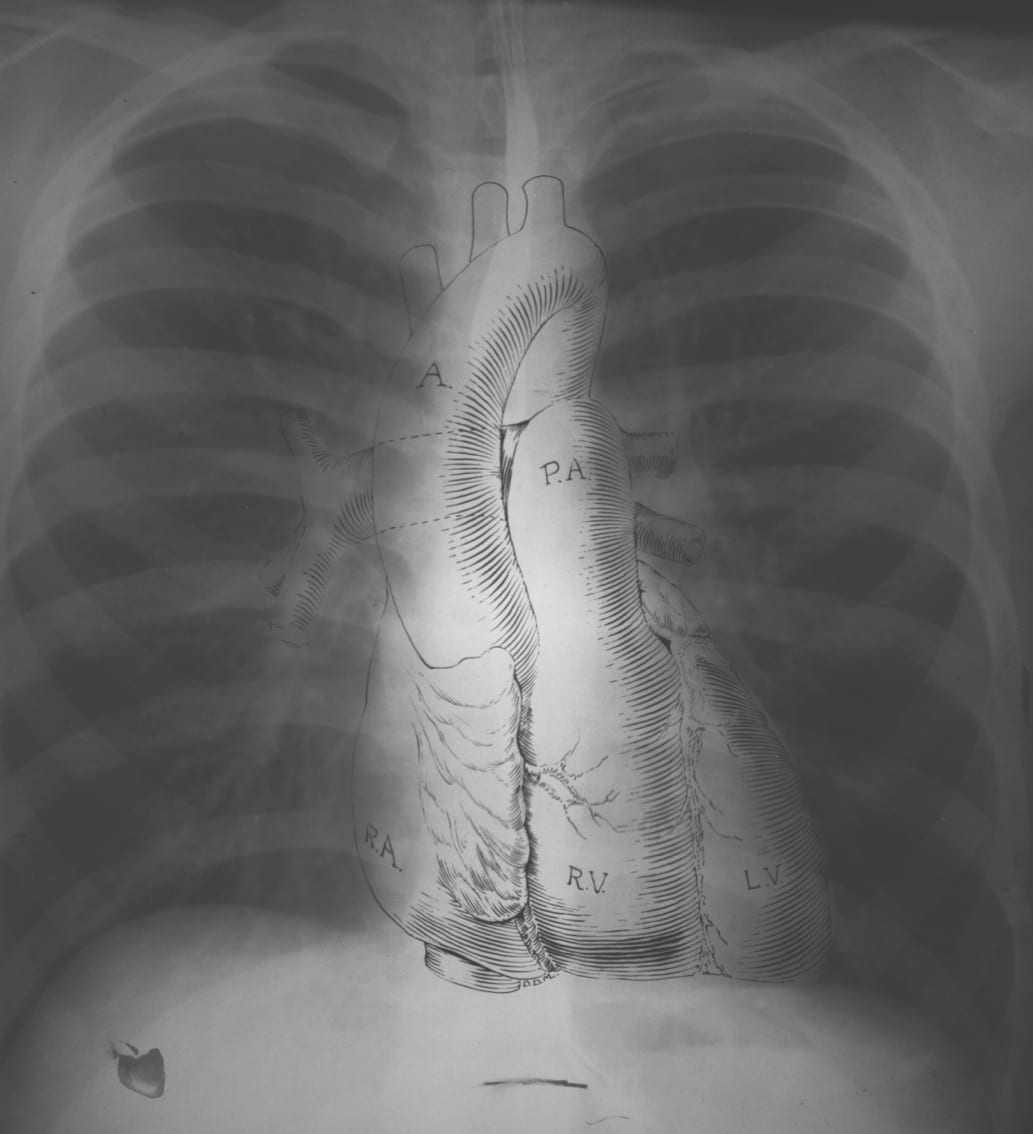
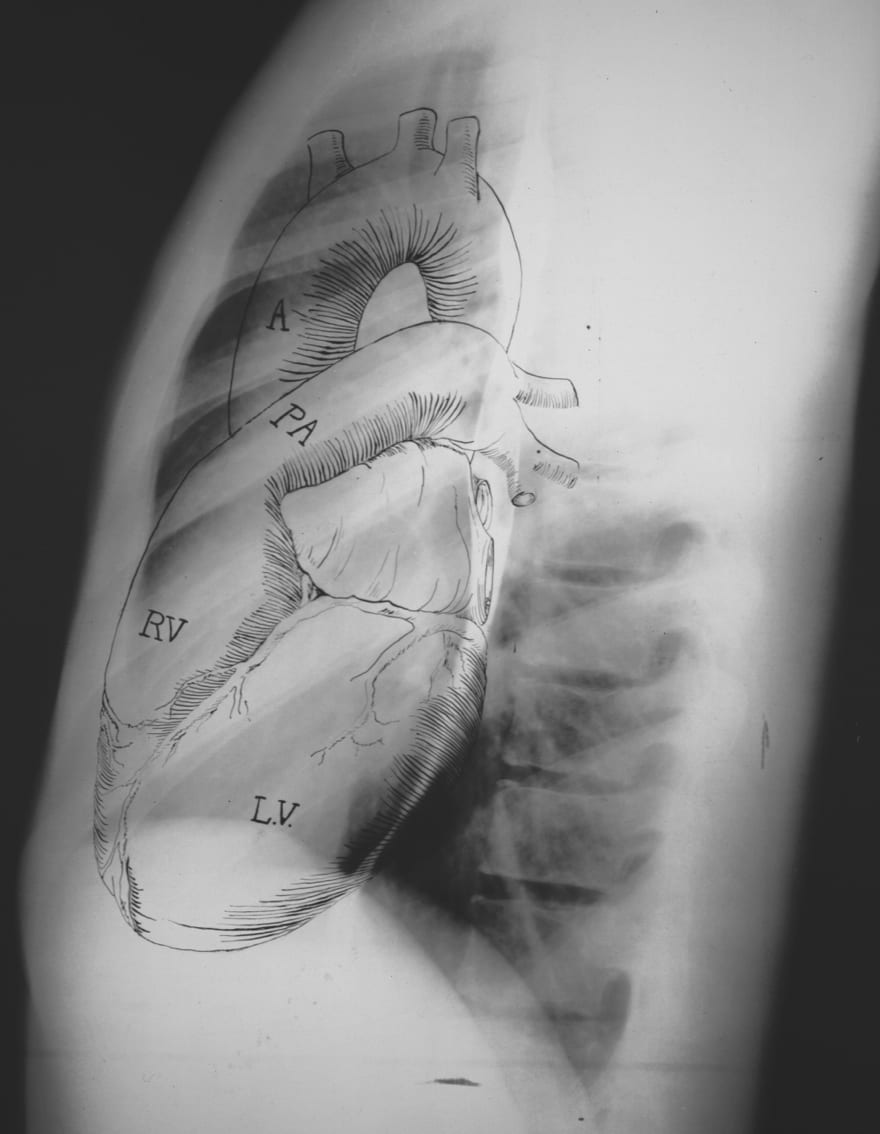
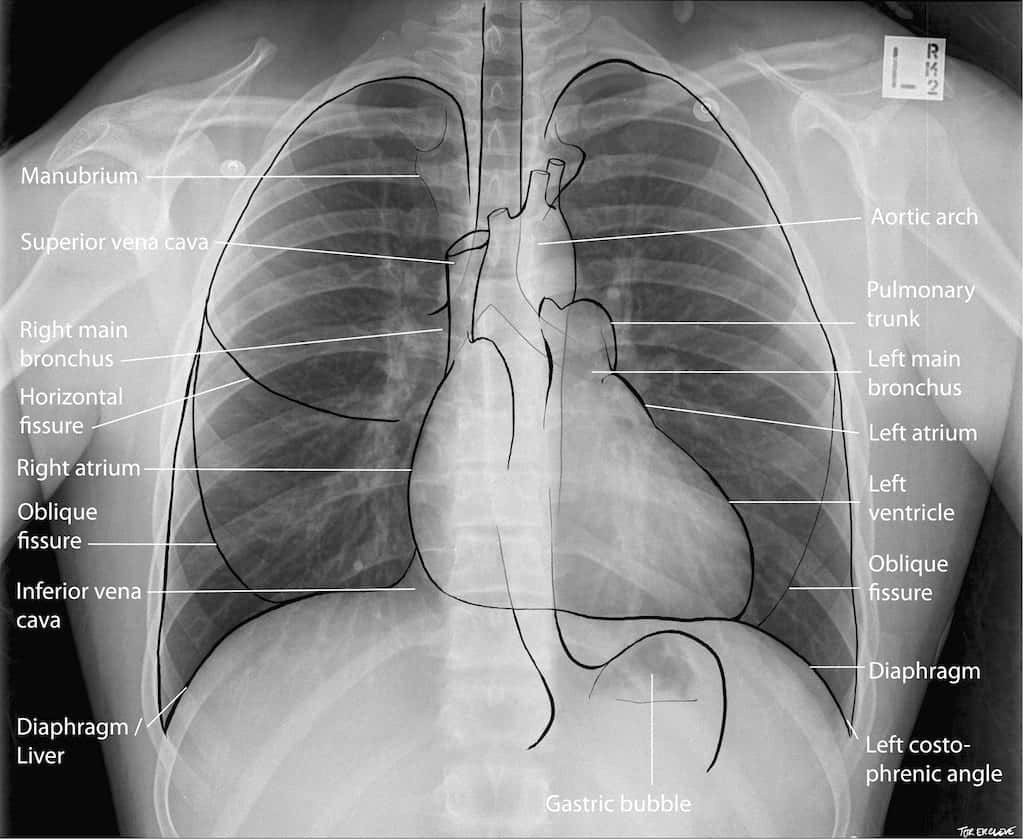
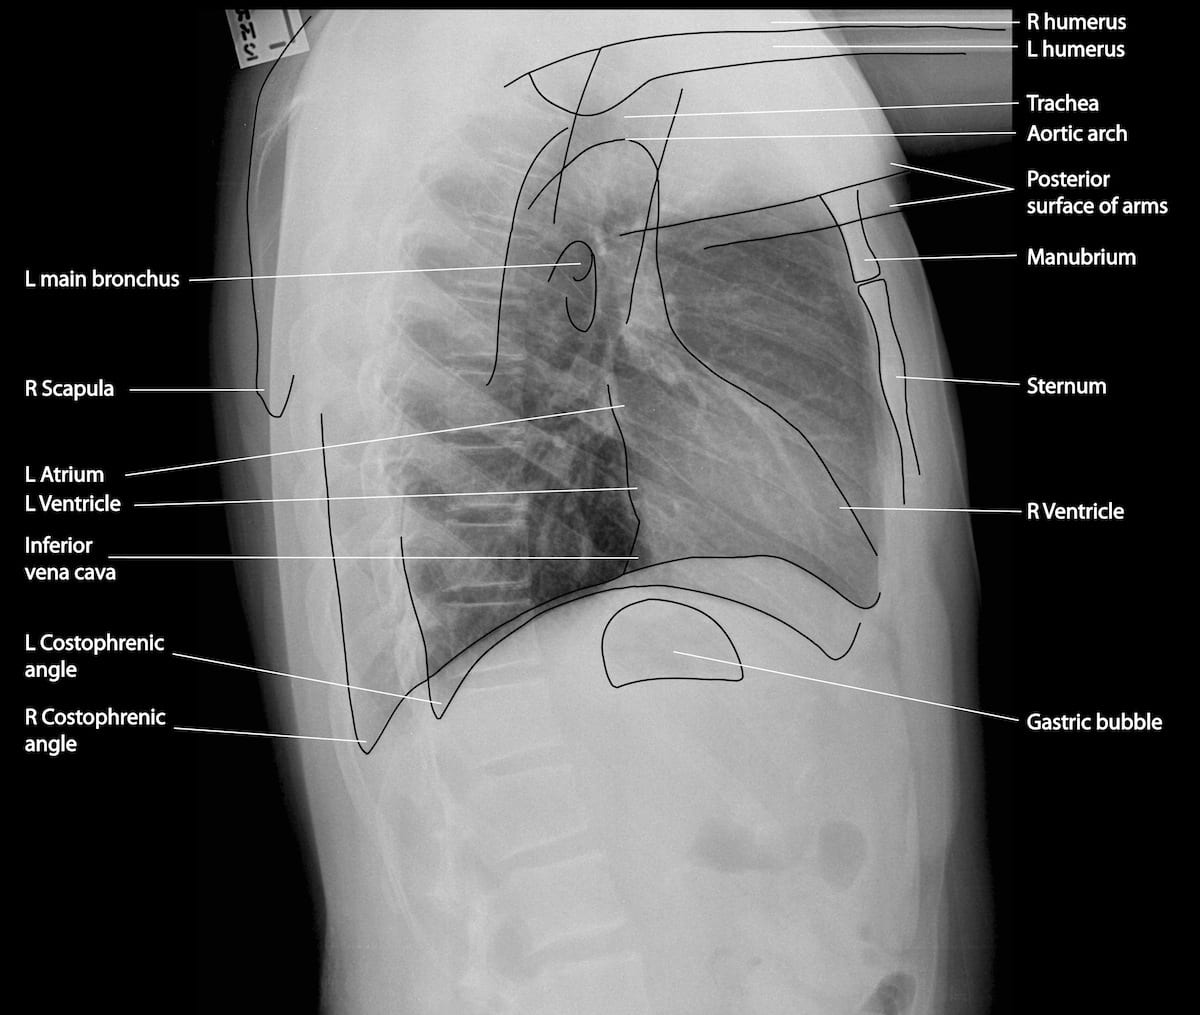
Anatomy
Approach
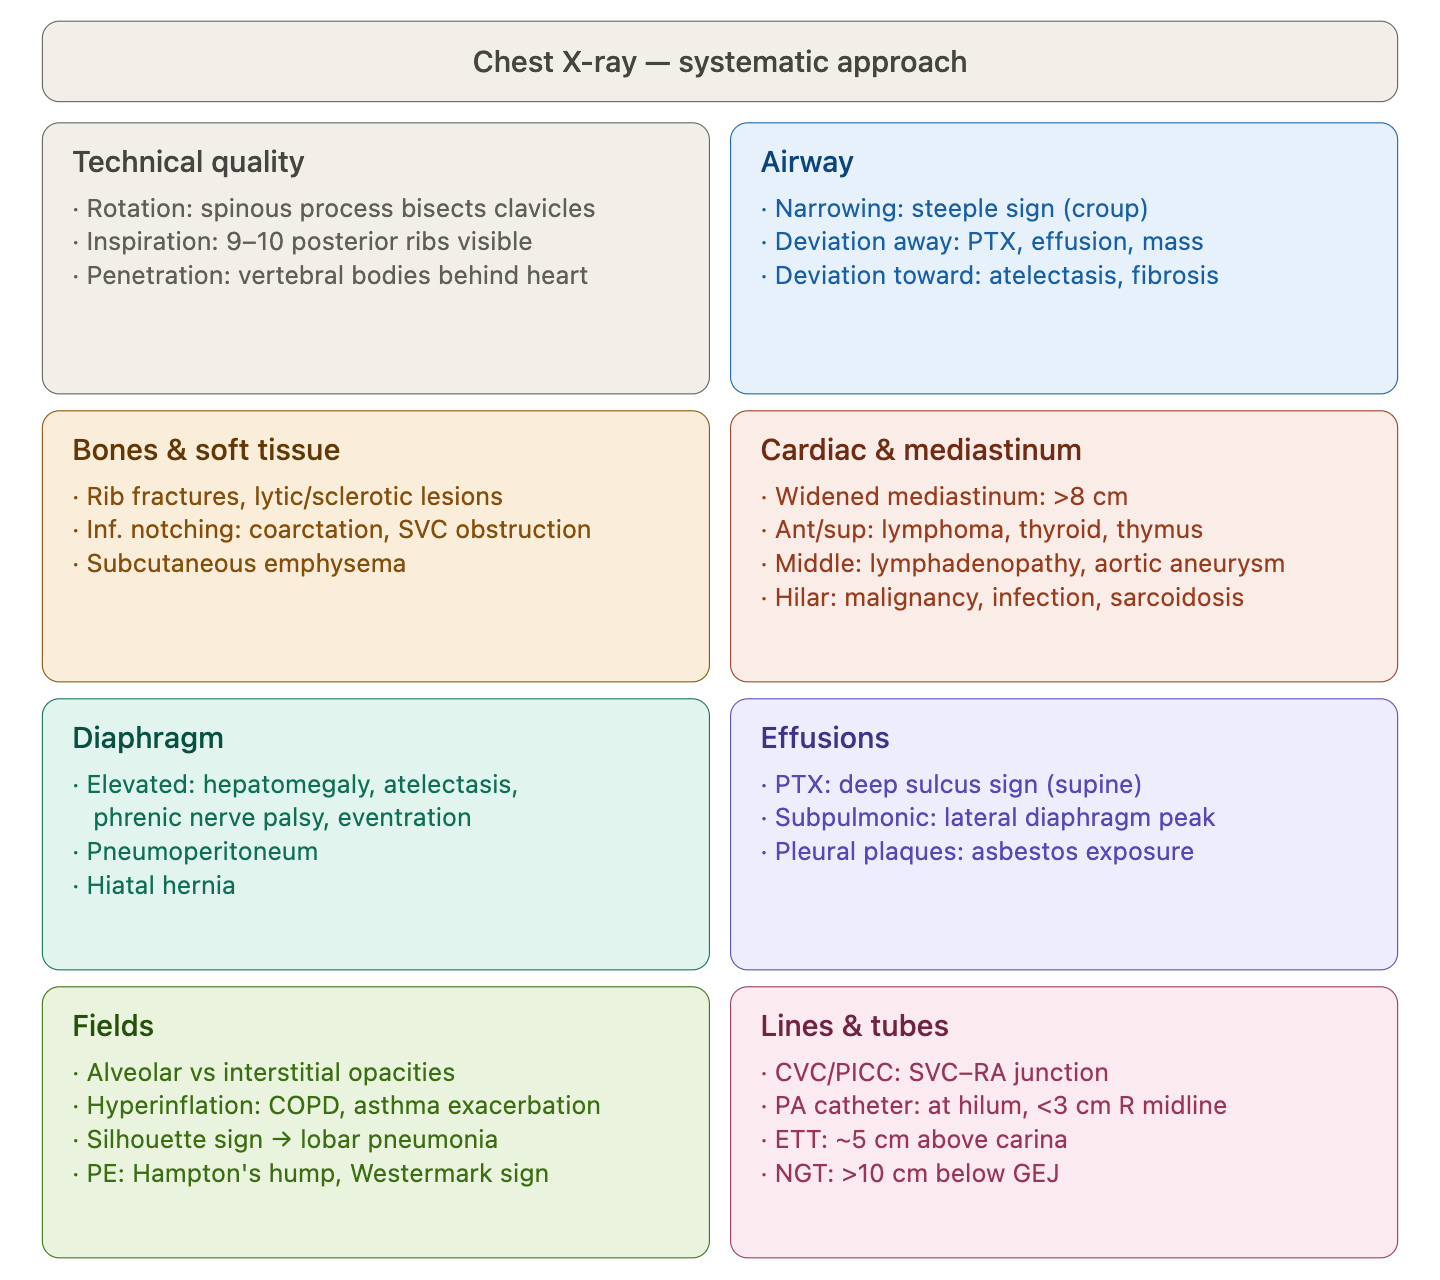
Technical Quality
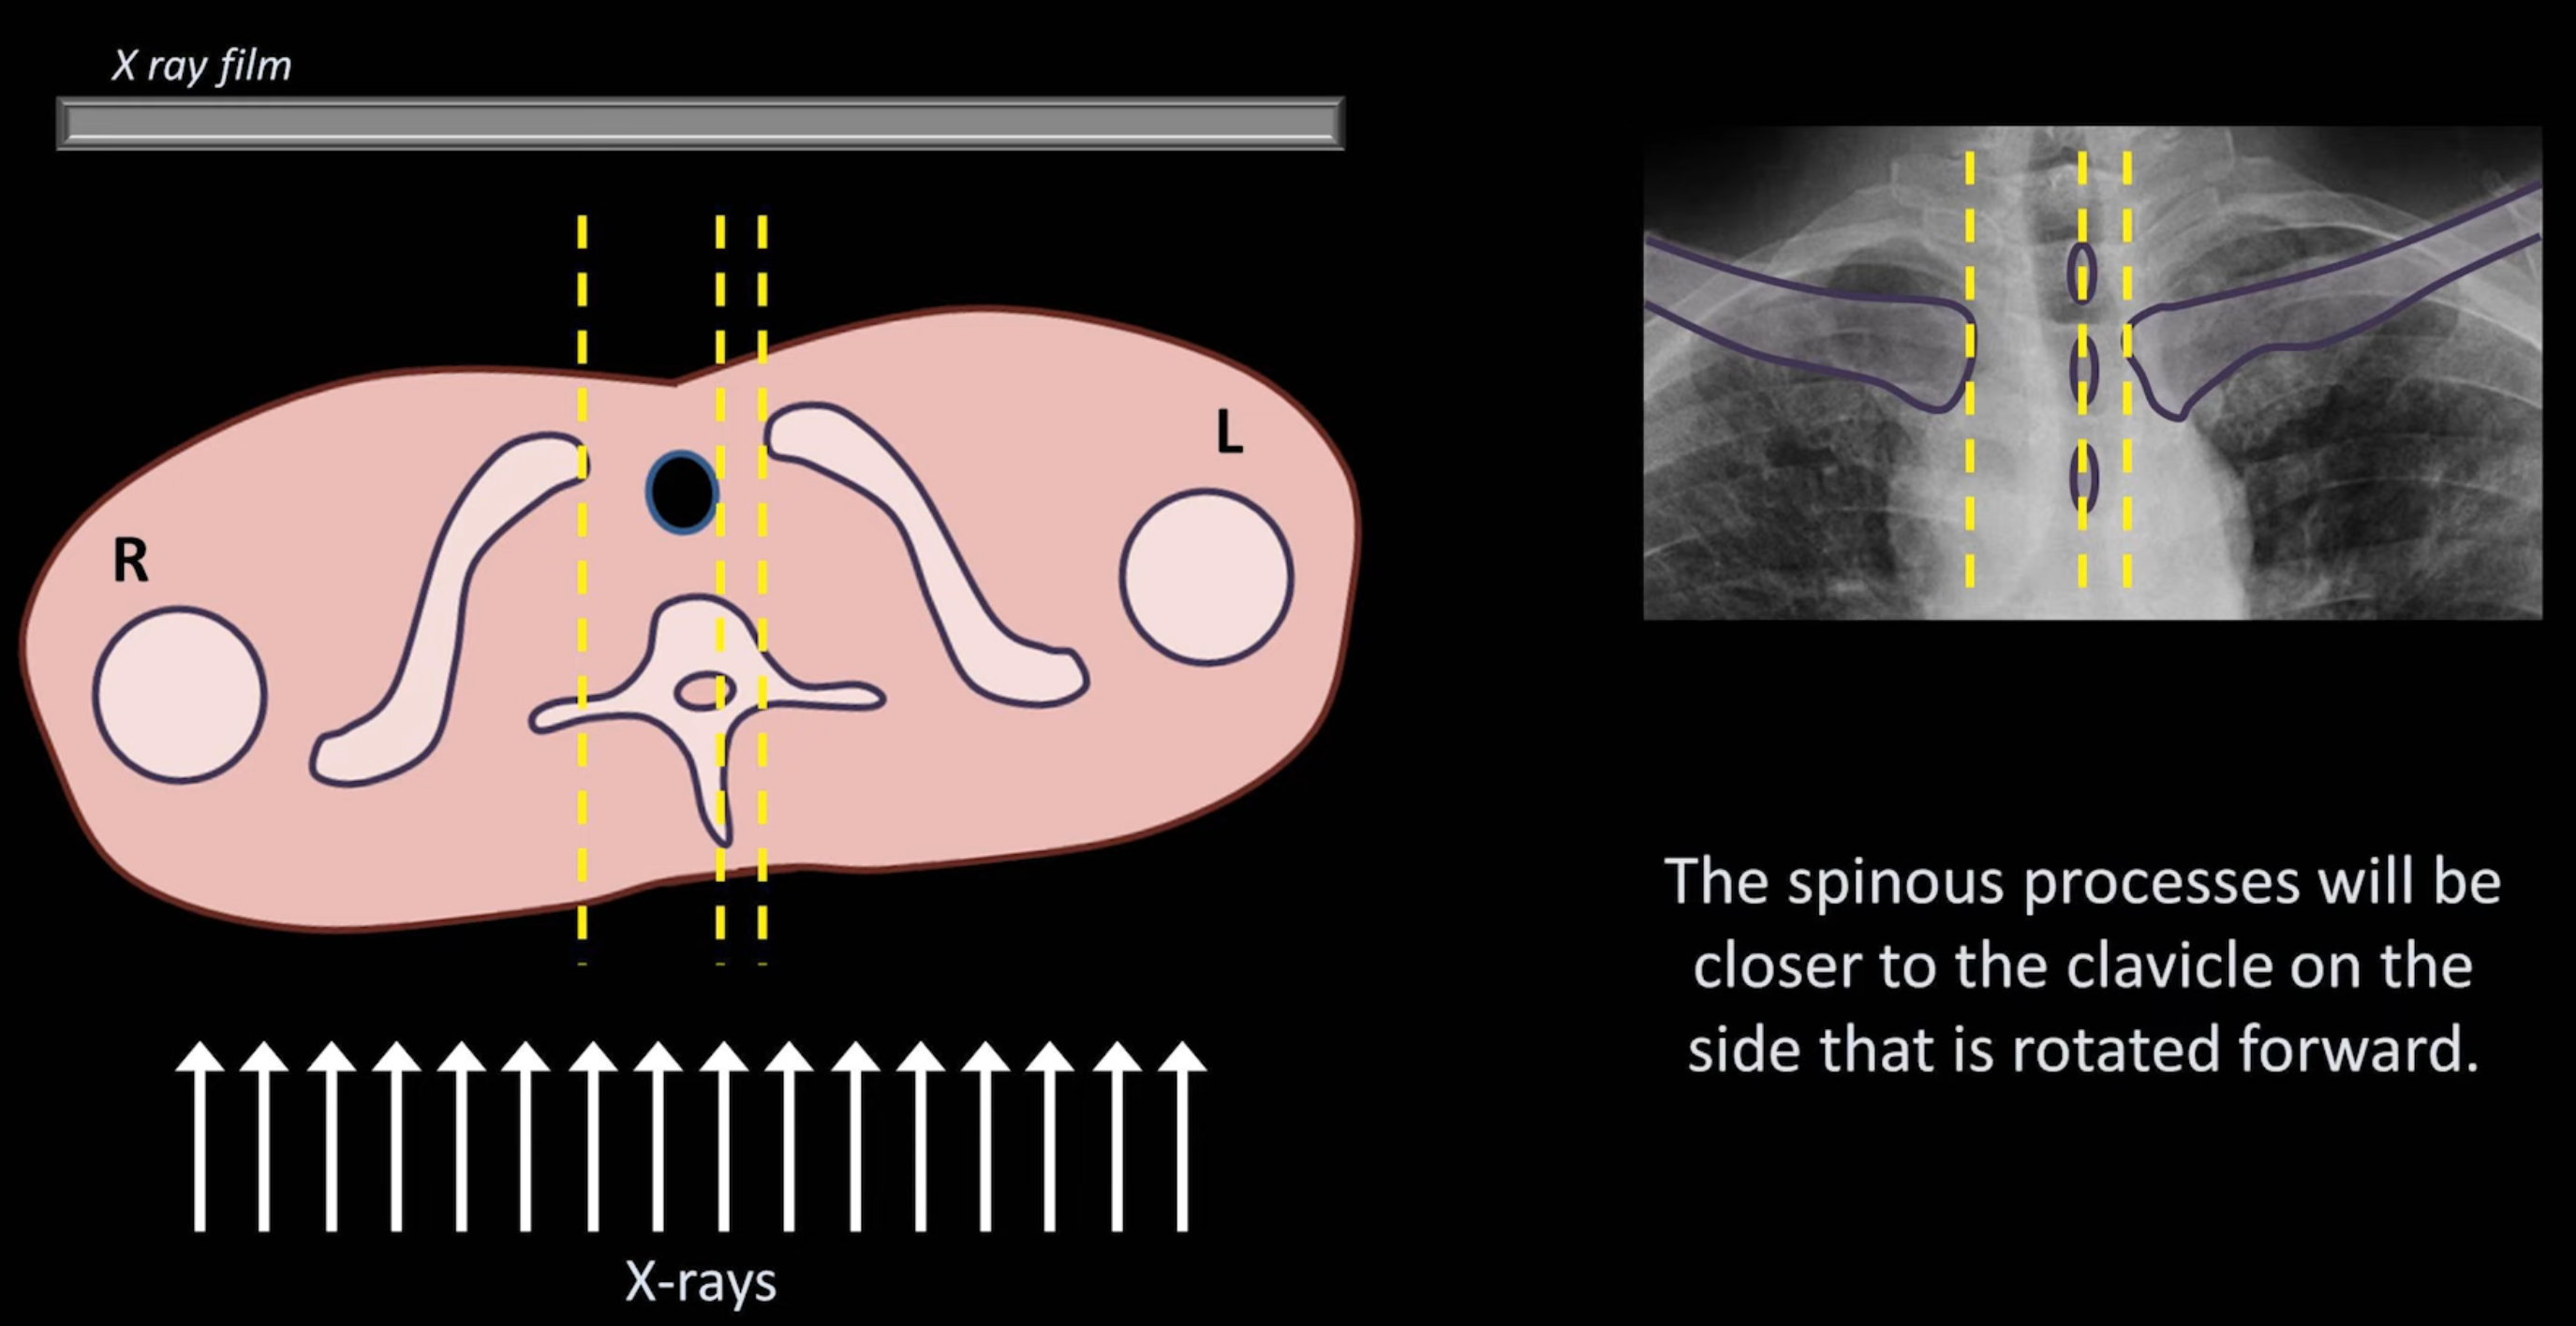
Rotation
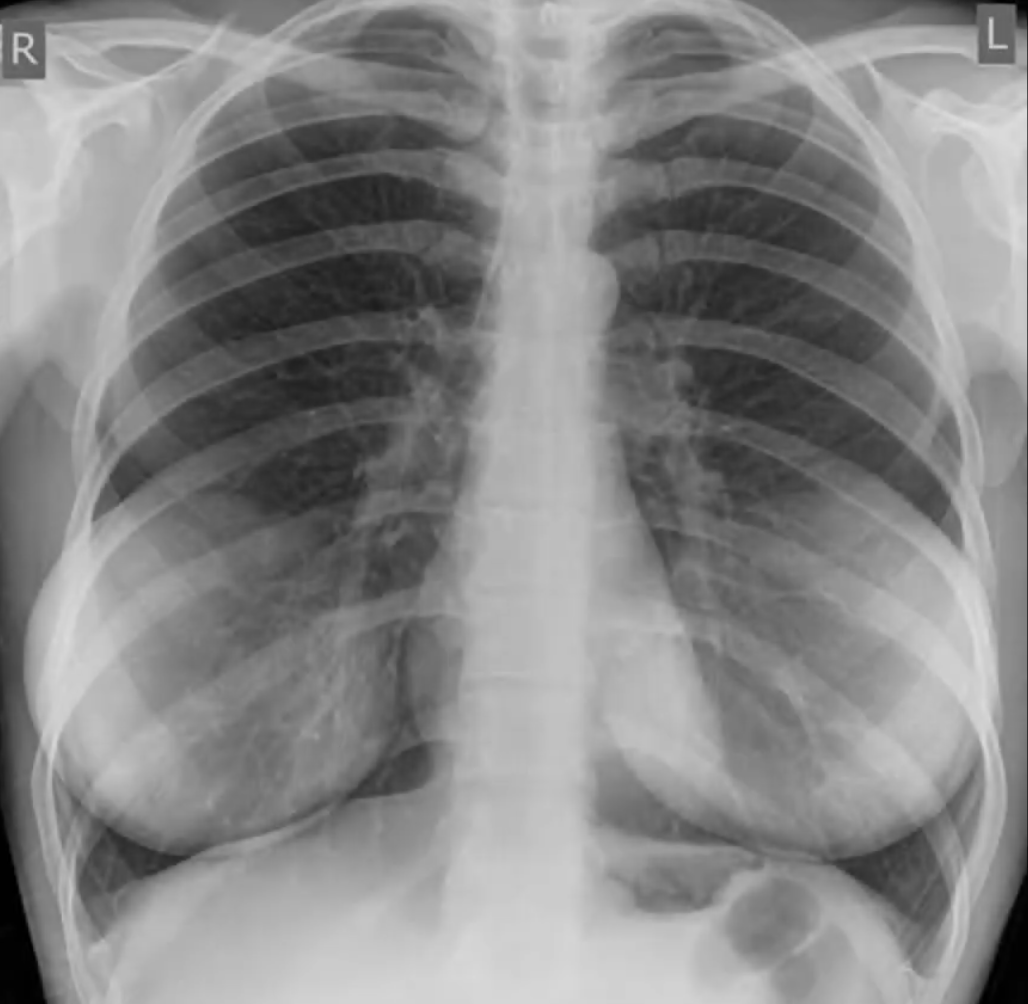
Ensure the patient is not crooked (rotated/slumped to one side). Ensure lung apices are visible above the clavicles. Ensure the vertebral spinous processes bisect the distance between the medial ends of the clavicle.
- The spinous processes will be closer to the clavicle on the side that is rotated forward
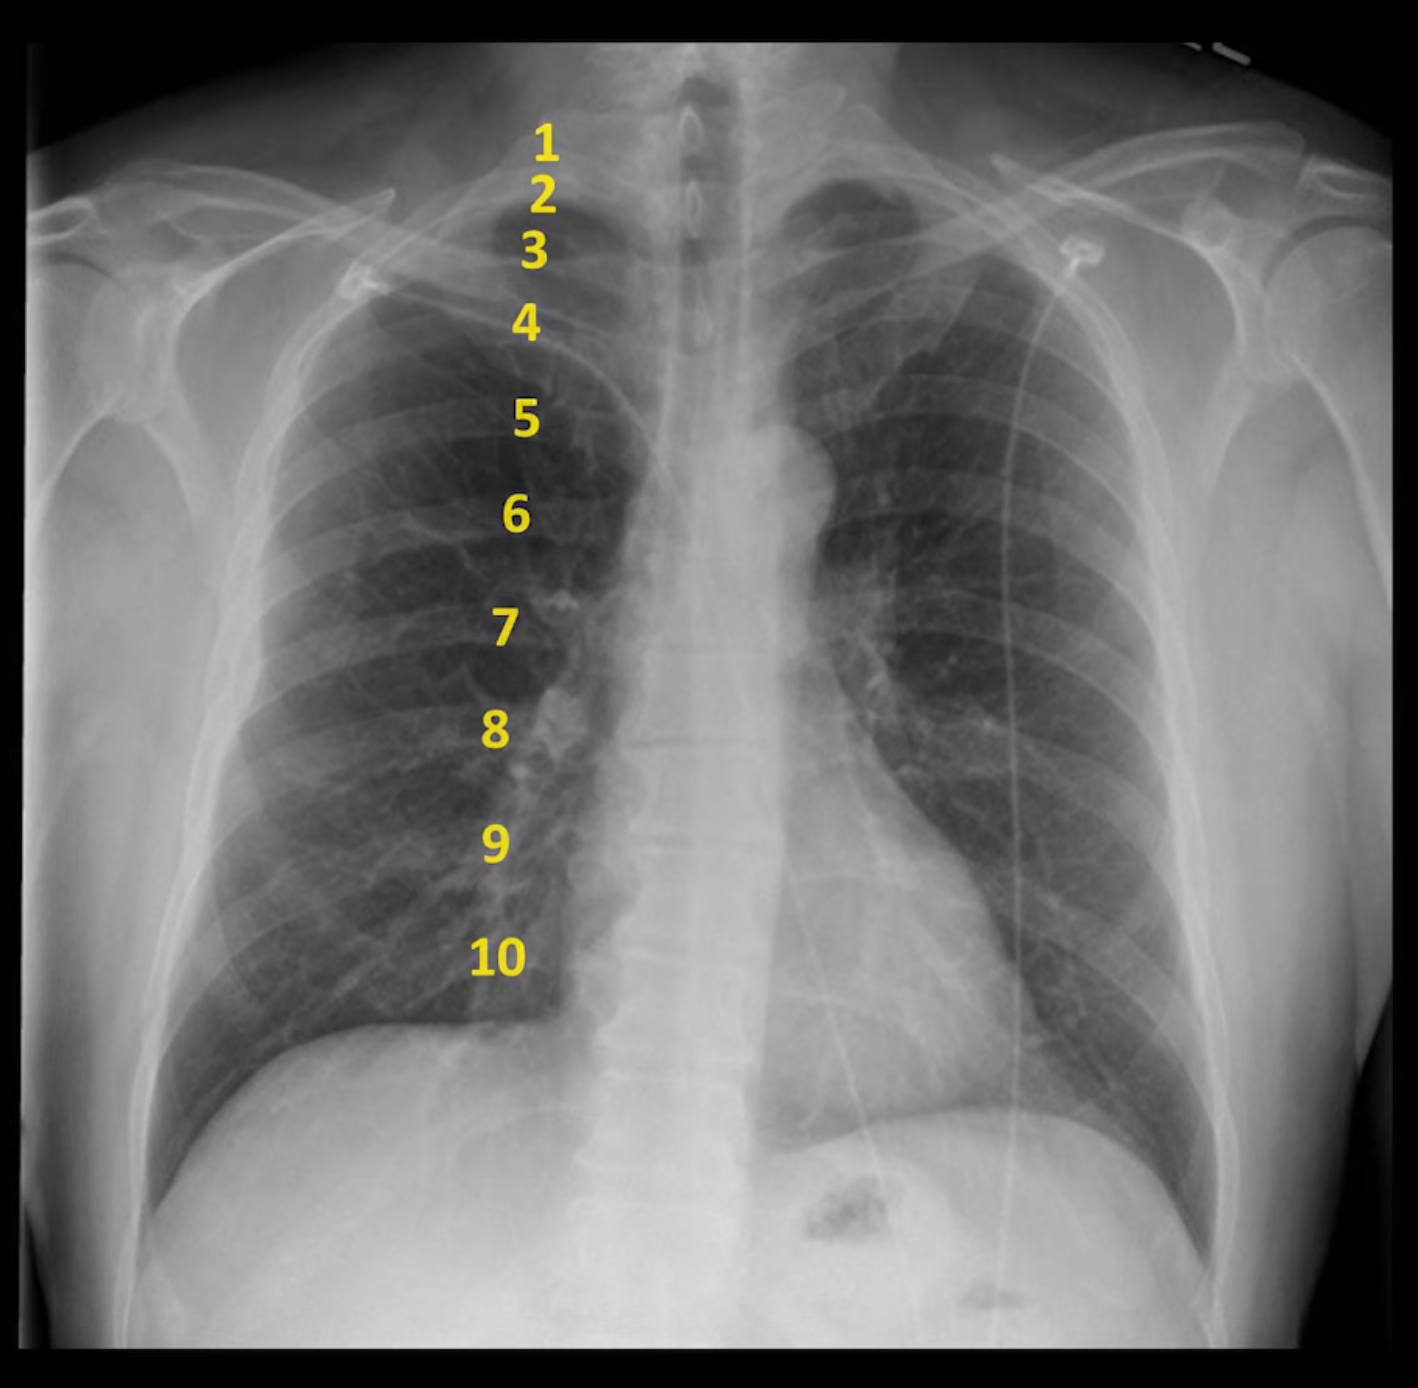
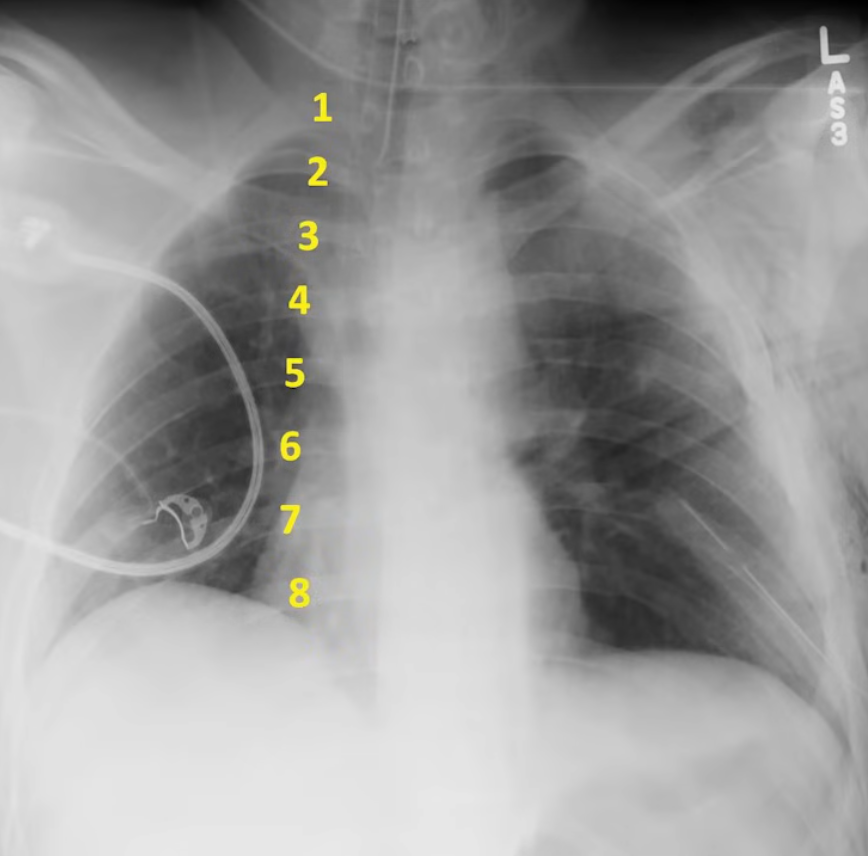
Penetration
Considered good when the outlines of the vertebral bodies are visible behind the heart (focus on inter-vertebral spaces).
Airway
Assess for:
- Narrowing (e.g. croup; steeple sign)
- Deviation
- Away from affected side: pneumothorax, pleural effusion, large mass
- Towards the affected side: marked atelectasis, lobectomy/pneumonectomy, pleural fibrosis, pulmonary fibrosis (although rarely unilateral)
- Foreign objects
Bones and Soft Tissue
Bones
- Rib fractures
- Lytic and sclerotic lesions
- Rib notching
- Superior surface: osteogenesis imperfecta, connective tissue disorders, hyperparathyroidism
- Inferior surface: coarctation of the aorta, subclavian or SVC obstruction
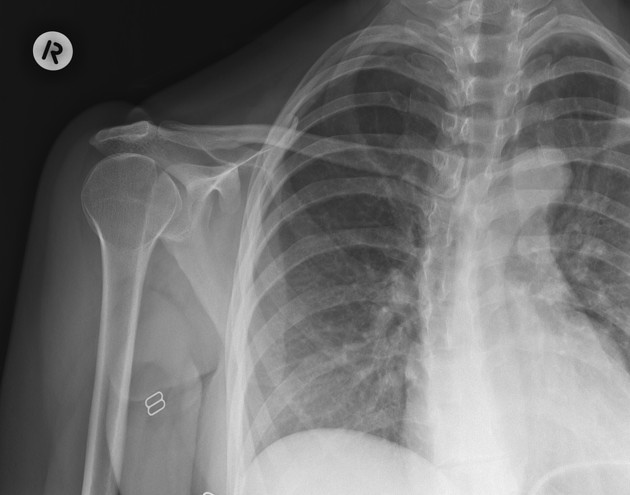
- Sternoclavicular joint dislocation (usually uncommon unless high impact mechanism)
- Inferior displacement of the medial ends of the clavicle suggests posterior dislocation (see: Radiopaedia case) - requires thoracic CT angiogram to assess for vascular, airway or oesophageal injury
- Superior displacement on X-ray suggests anterior dislocation
Soft Tissue
- Subcutaneous emphysema
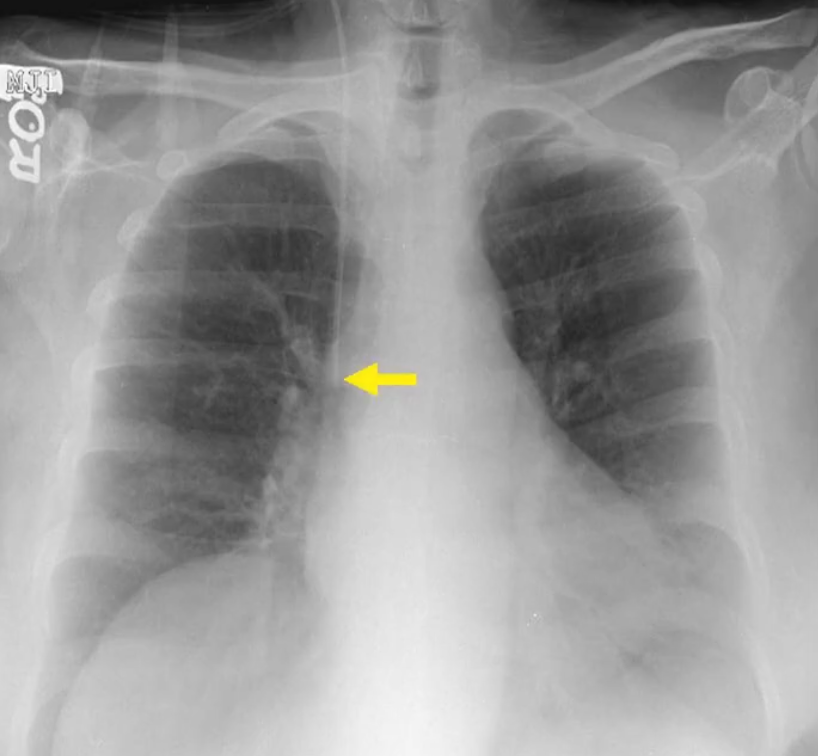
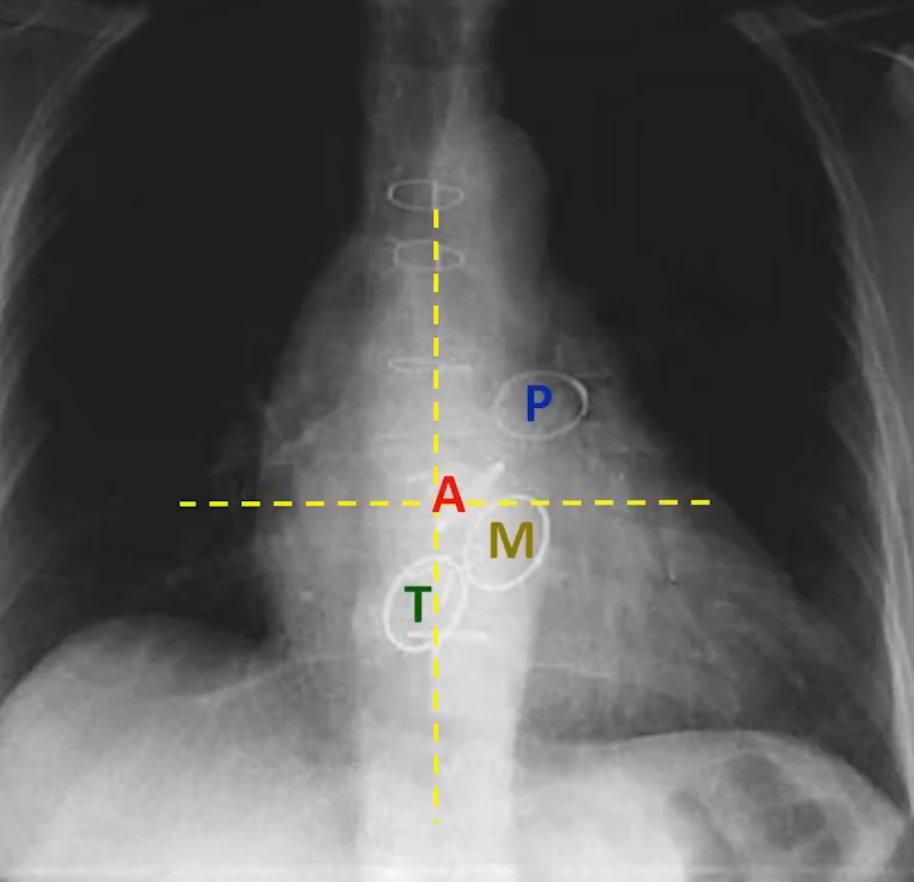
Cardiac Silhouette and Mediastinum
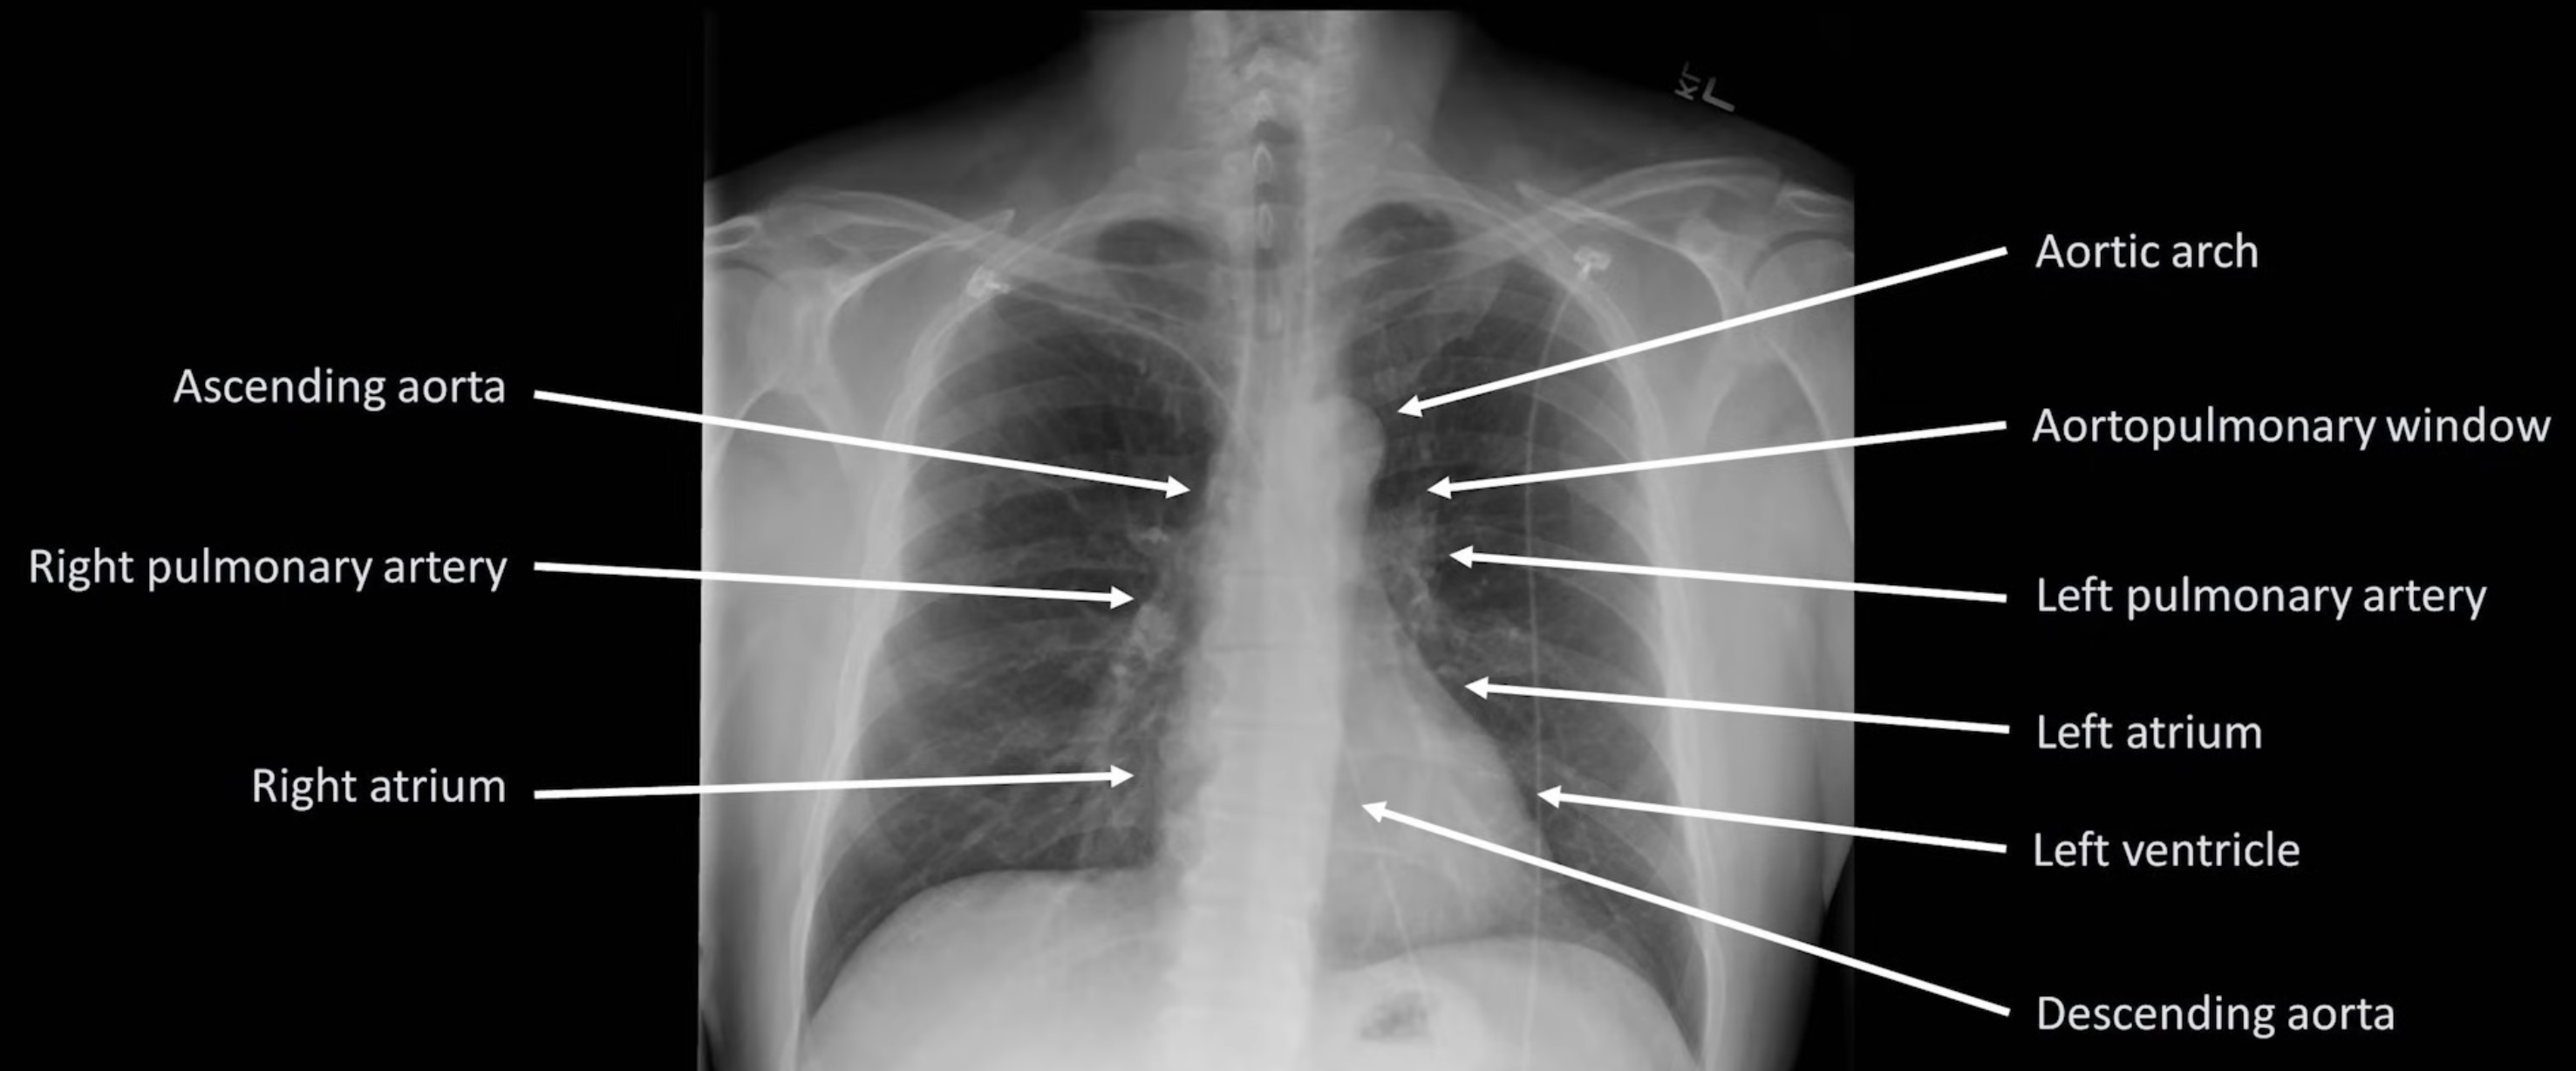
- Widened mediastinum is defined as >8cm.
Hilar Enlargement — Differentials
- Malignancy: primary lung cancer, lymphoma, metastatic disease
- Infection: tuberculosis, viruses (e.g. EBV)
- Other: sarcoidosis, silicosis, pulmonary hypertension, pulmonary artery aneurysm, bronchogenic cyst
Other
- Pneumomediastinum
- Pneumopericardium
Diaphragm
Elevated Hemidiaphragm
Can be due to: hepatomegaly or splenomegaly, diminished lung volume (e.g. atelectasis), phrenic nerve paralysis, eventration of the diaphragm, or subphrenic abscess.
Other
- Pneumoperitoneum
- Hiatal hernia
Effusions
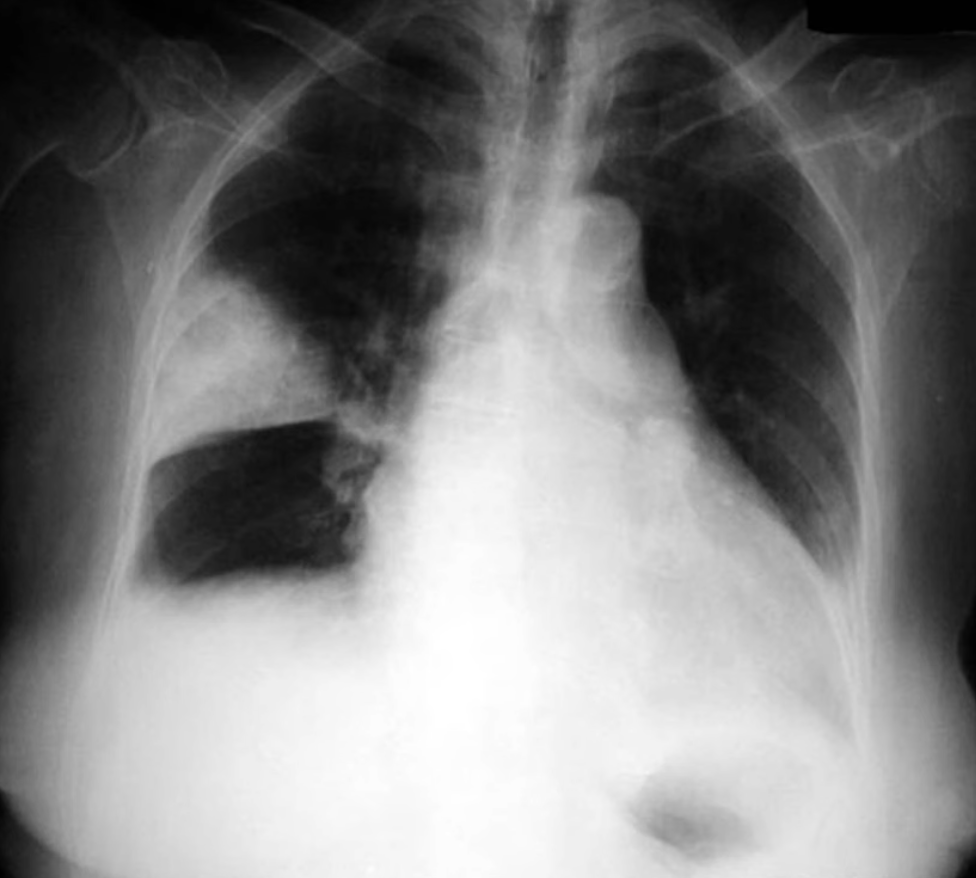
Pneumothorax
- Can use an expiratory film to substantiate findings
- Deep sulcus sign in supine patients
Pleural Effusion
Small effusions are often first visible on the lateral film before the AP.
Subpulmonic Effusion
Fluid accumulation between the lung base and the diaphragm, not tracking up the pleura and therefore not blunting the costophrenic angle.
Suggested by:
- Diaphragm appears to peak more laterally than normal
- Diaphragm appears more horizontal than normal
- On left: abnormally large distance between gastric bubble and lung base
- On right: abnormally high horizontal fissure
Pleural Plaques
Typically bilateral, multifocal and relatively symmetric; usually indicative of prior asbestos exposure.
Fields
Diffuse Lung Volume Processes
Reduced Lung Volume
Defined as <9 posterior ribs. Can be due to: poor inspiratory effort, suboptimally timed exposure, restrictive lung disease, subpulmonic effusions.
Hyperinflation
Subjective impression that total lung capacity is likely increased based upon number of ribs seen, flattening of the diaphragms, and diffusely increased lucency of the lungs. Seen in COPD and asthma only during exacerbations.
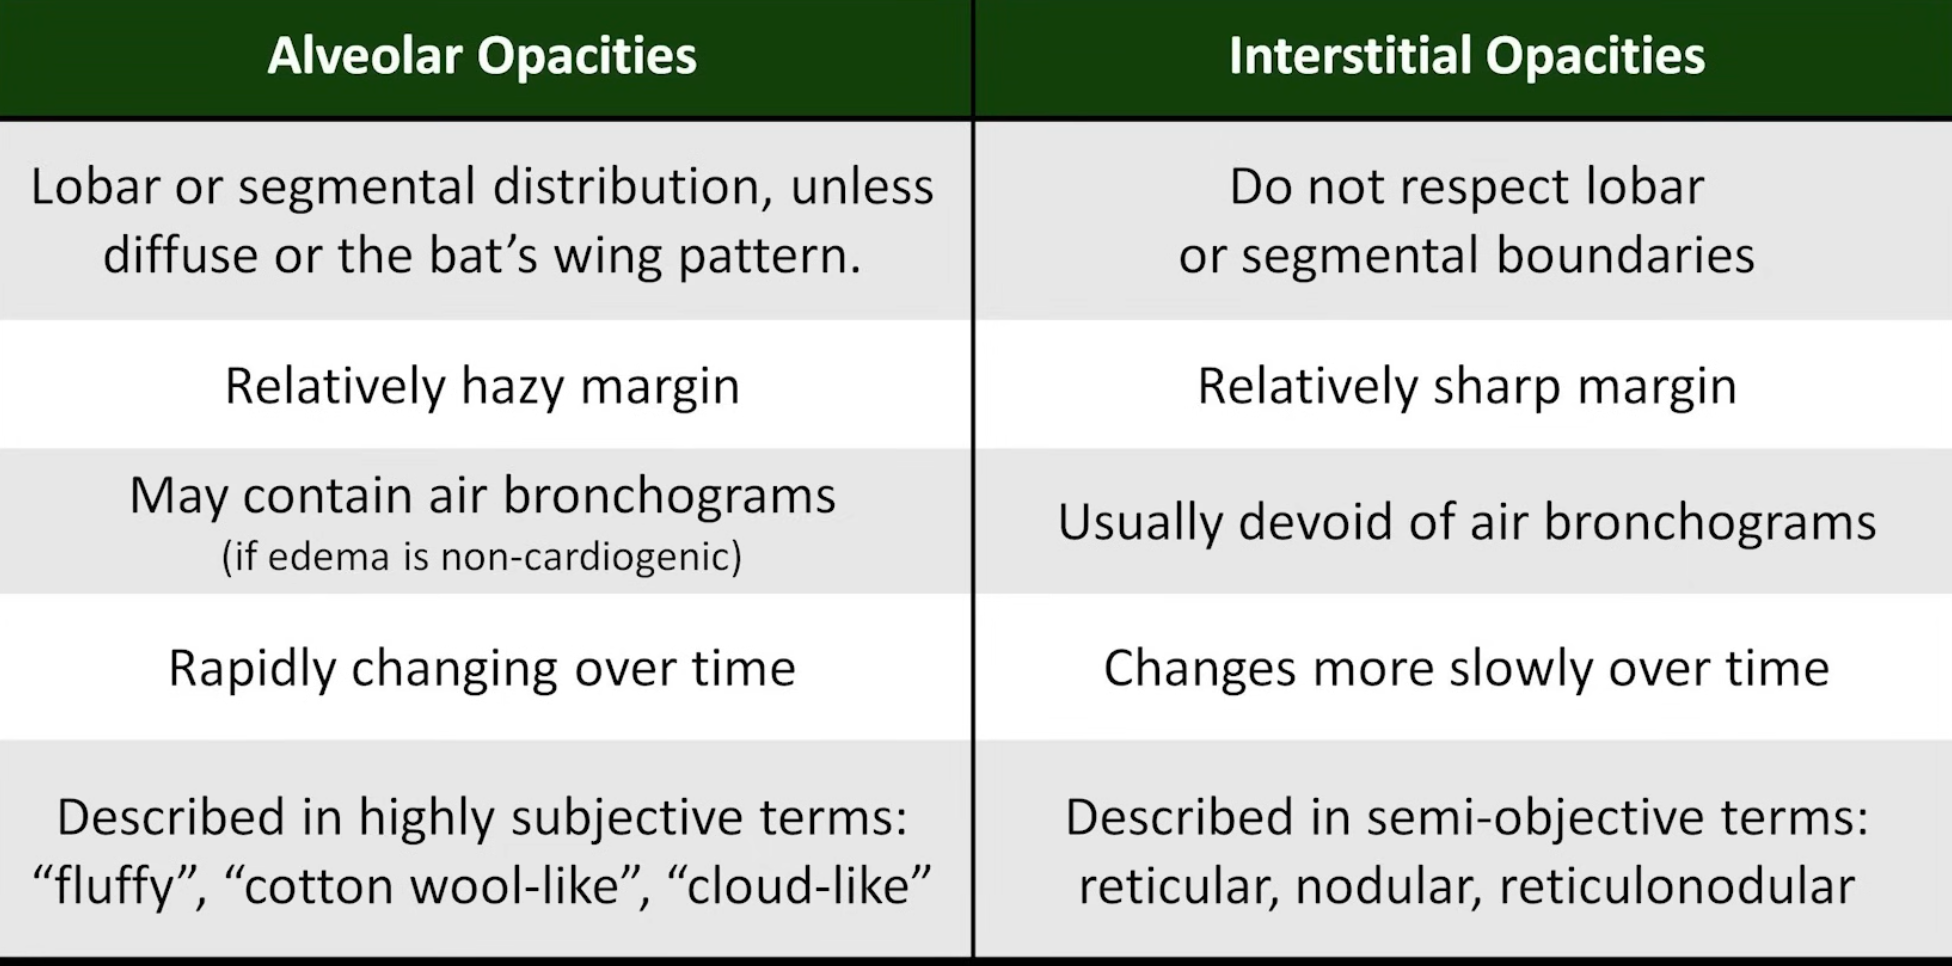
Alveolar (Airspace) Opacities
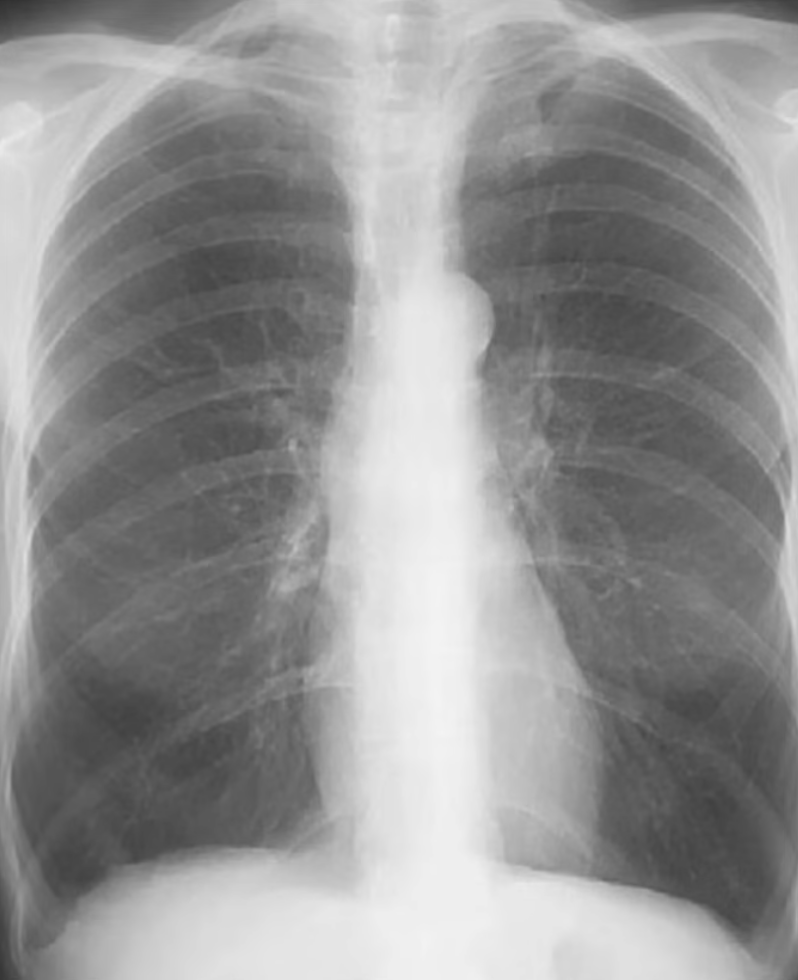
Due to fluid accumulation within the alveoli and terminal bronchioles; fluid may be oedema, pus, or blood. Opacities are hazy with poorly defined margins but can respect lobar boundaries (unless diffuse).
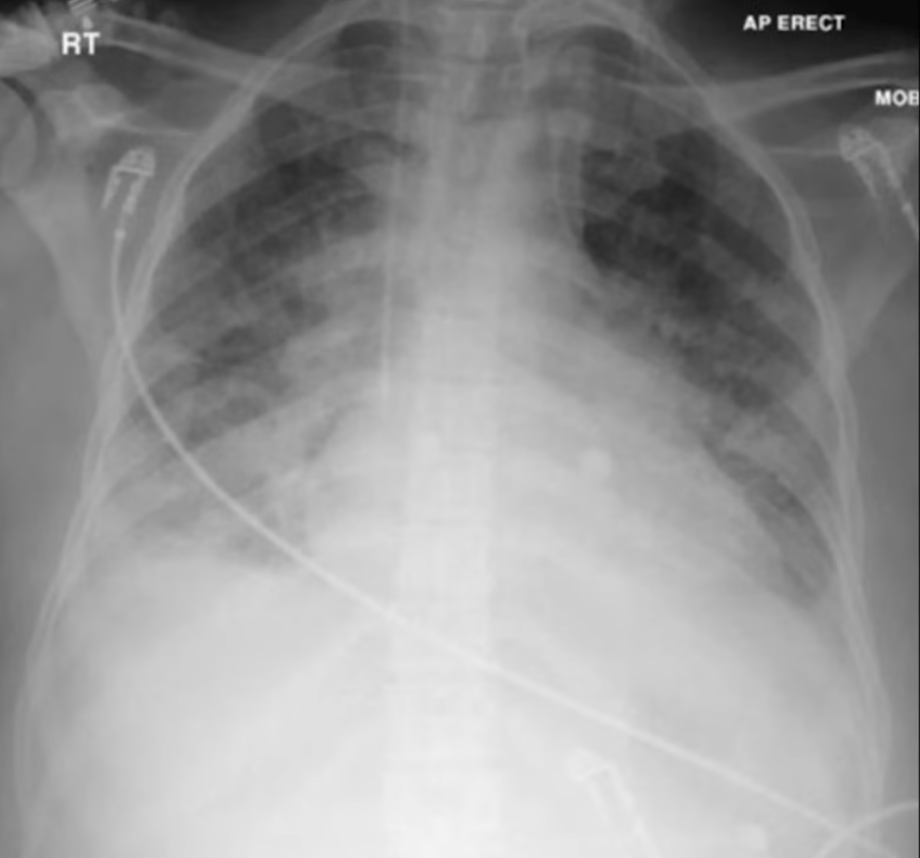
Differentials are divided into cardiogenic and non-cardiogenic pulmonary oedema (see Acute Pulmonary Oedema). Non-cardiogenic pulmonary oedema defines a spectrum between acute lung injury and acute respiratory distress syndrome.
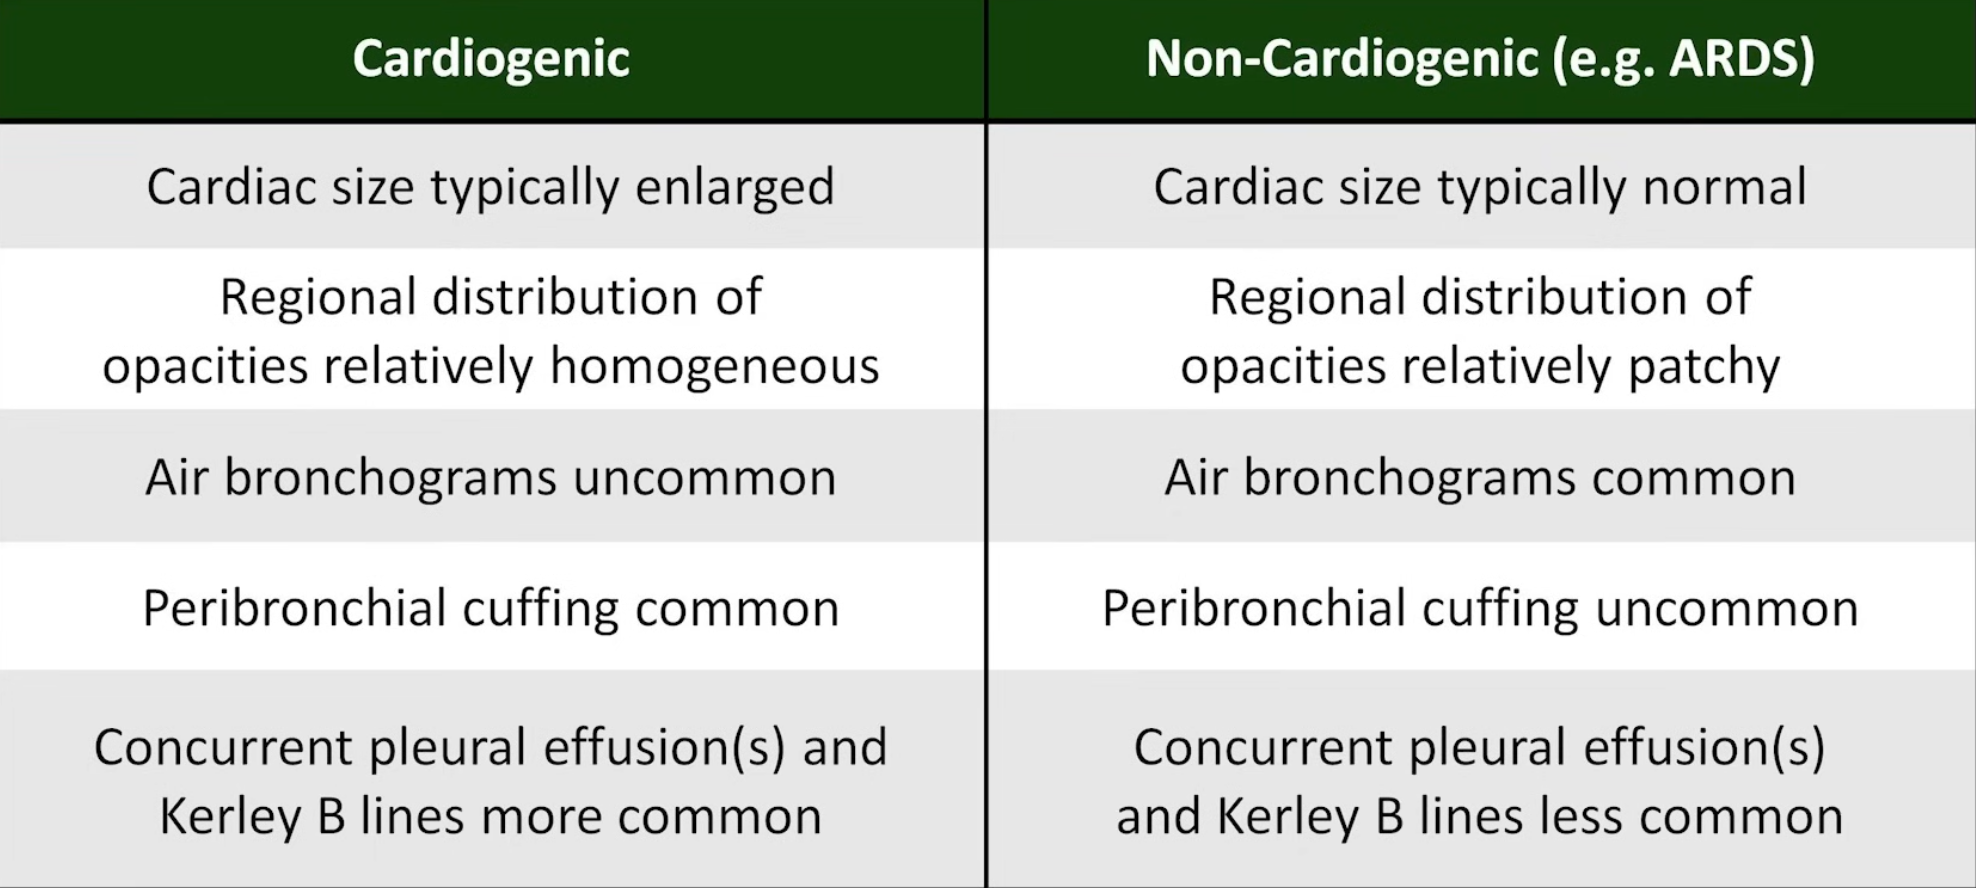
Differentiation of cardiogenic and non-cardiogenic pulmonary oedema:
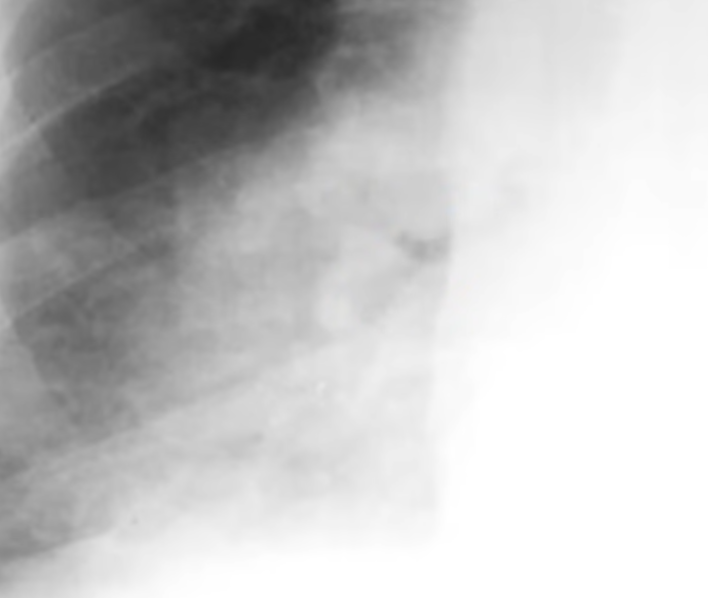

Kerley lines
- Kerley A lines are diagonal, unbranching lines 2–6 cm long extending from the hilum, representing channels between peripheral and central lymphatics
- Kerley B lines are faint thin horizontal lines 1–2 cm long at the lung periphery, usually at the bases, representing interlobular septa
Other features: cephalisation (upper lung diversion), bat’s wing pattern
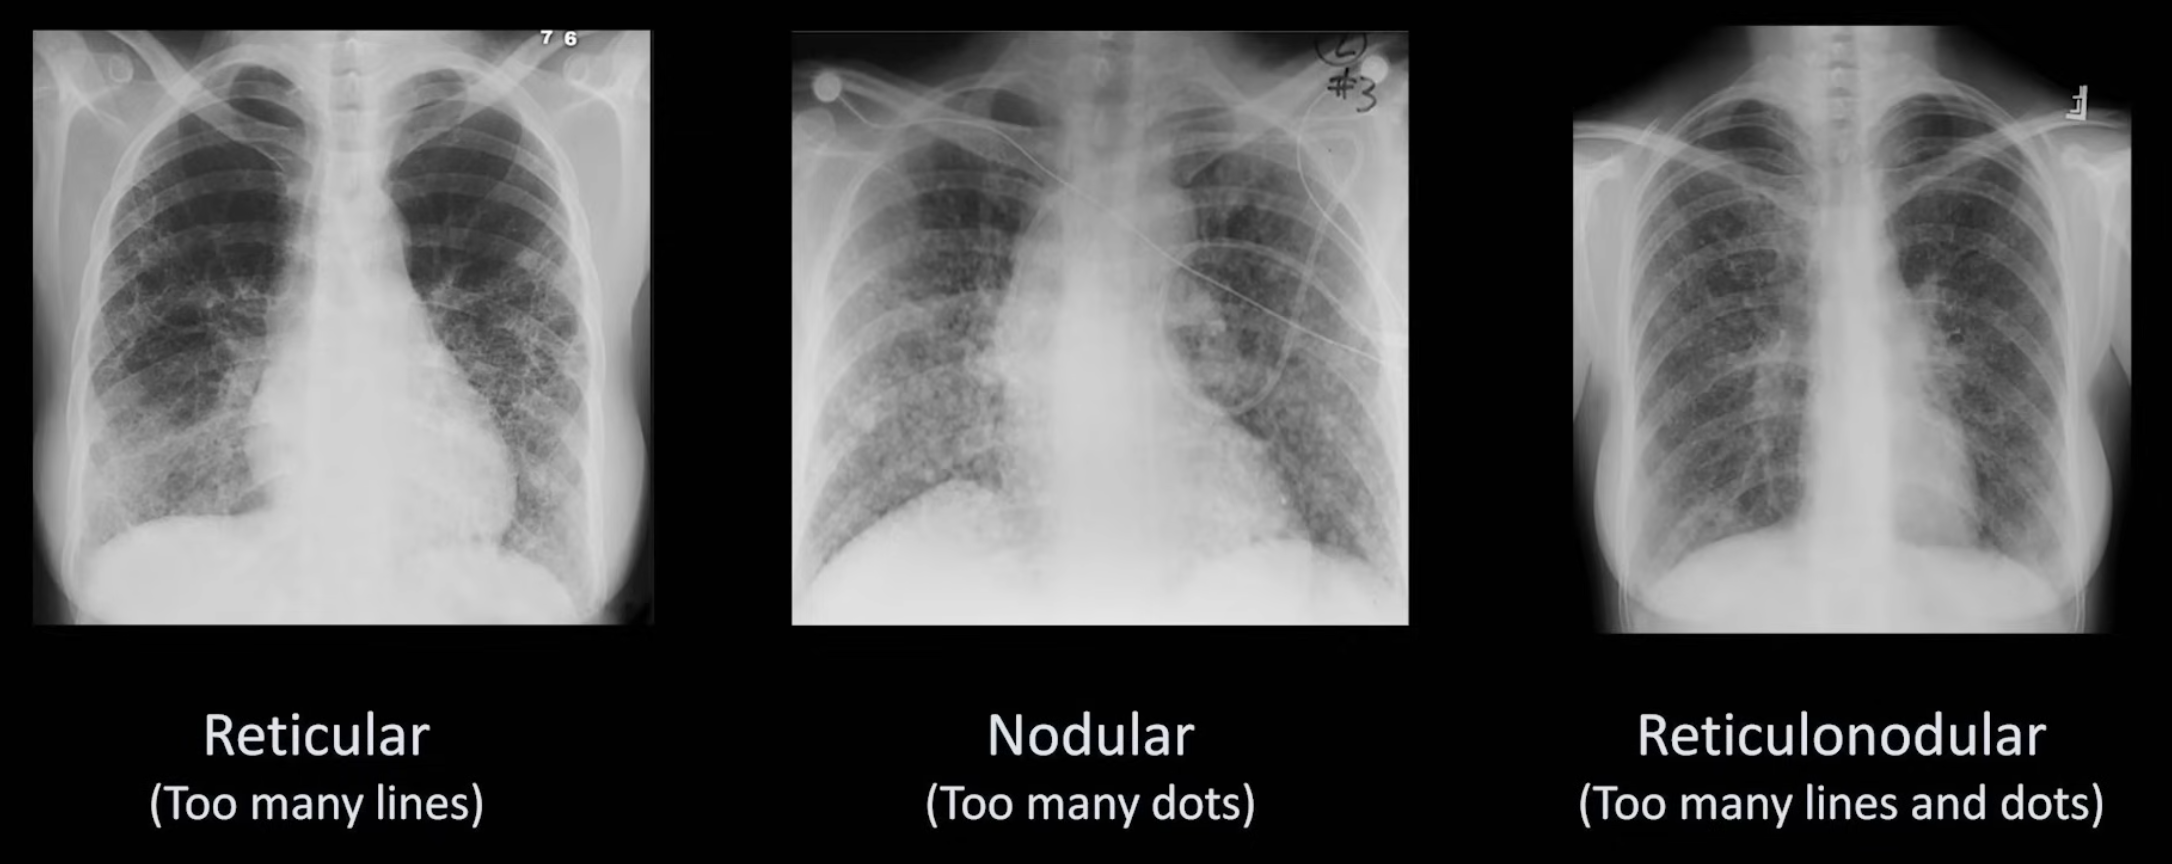
Interstitial Opacities
Further described based on pattern:
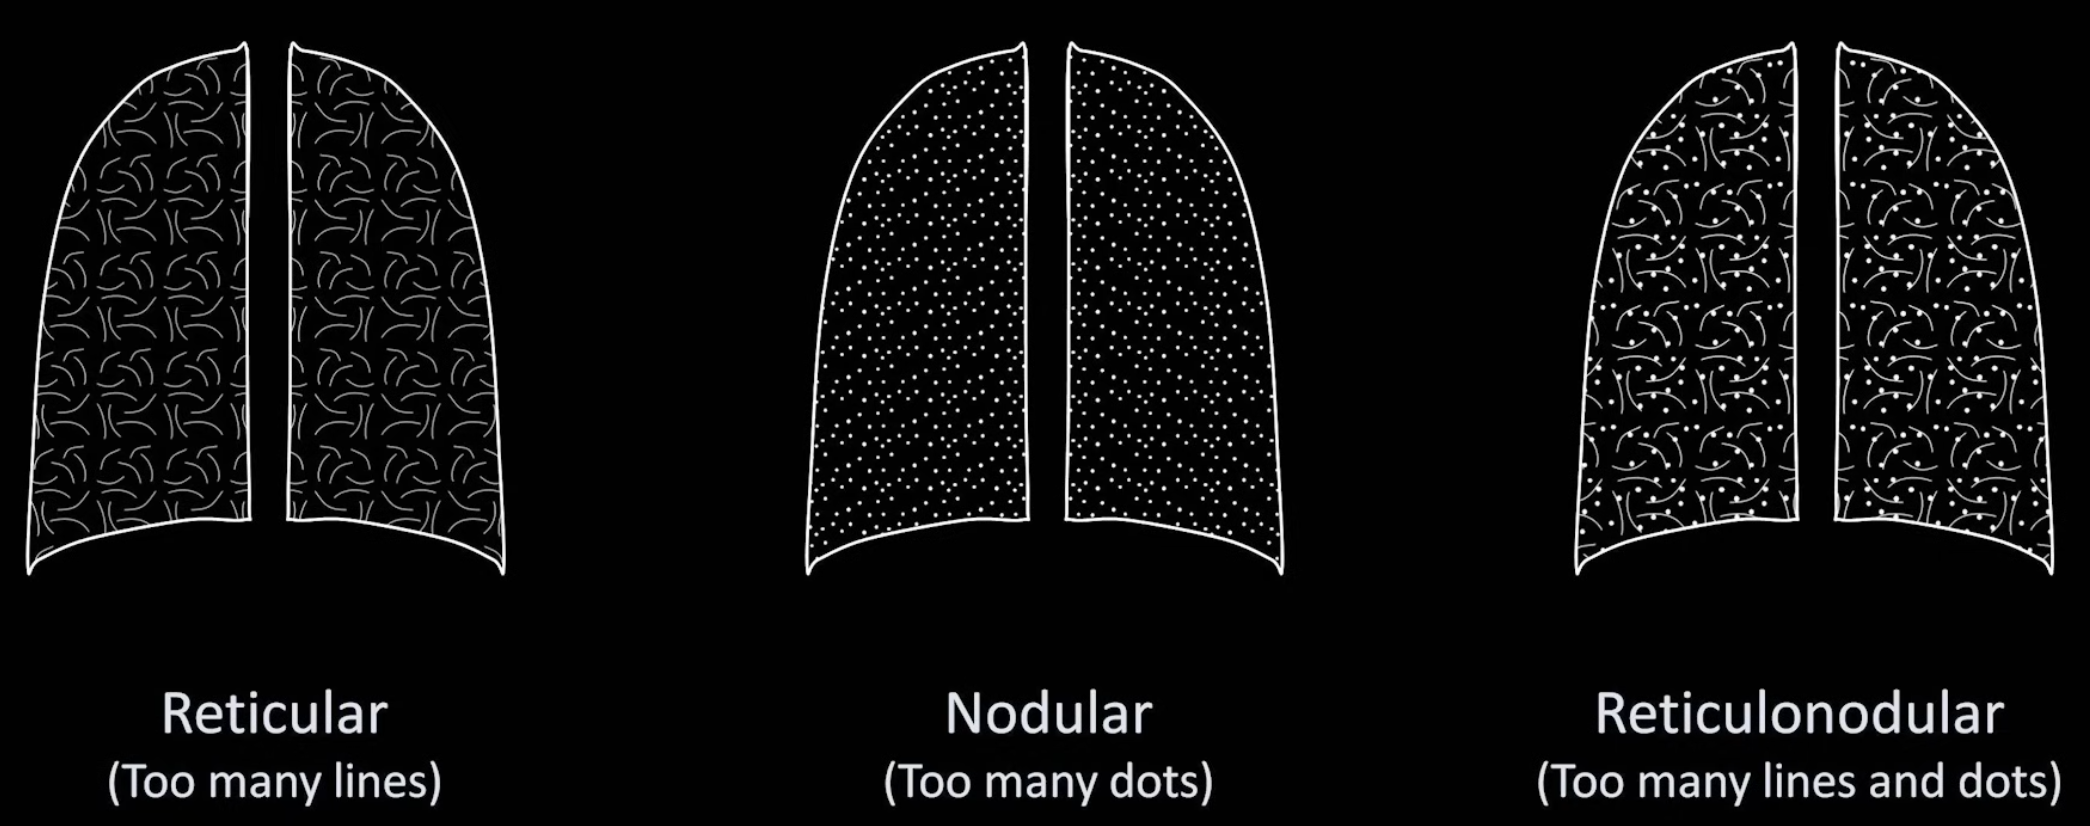
Differentials Predominantly reticular: idiopathic pulmonary fibrosis, connective tissue disorders (e.g. scleroderma, rheumatoid arthritis), atypical pneumonia, idiopathic interstitial pneumonia, asbestosis, chronic aspiration, pulmonary drug toxicity (e.g. nitrofurantoin), sarcoidosis, chronic hypersensitivity pneumonitis
Predominantly nodular:
- <2 cm: miliary tuberculosis, fungal infection, silicosis, sarcoidosis
- >2 cm: metastatic cancer, lymphoma, subacute hypersensitivity pneumonitis, granulomatosis with polyangiitis, rheumatoid nodules
Focal Lung Volume Processes
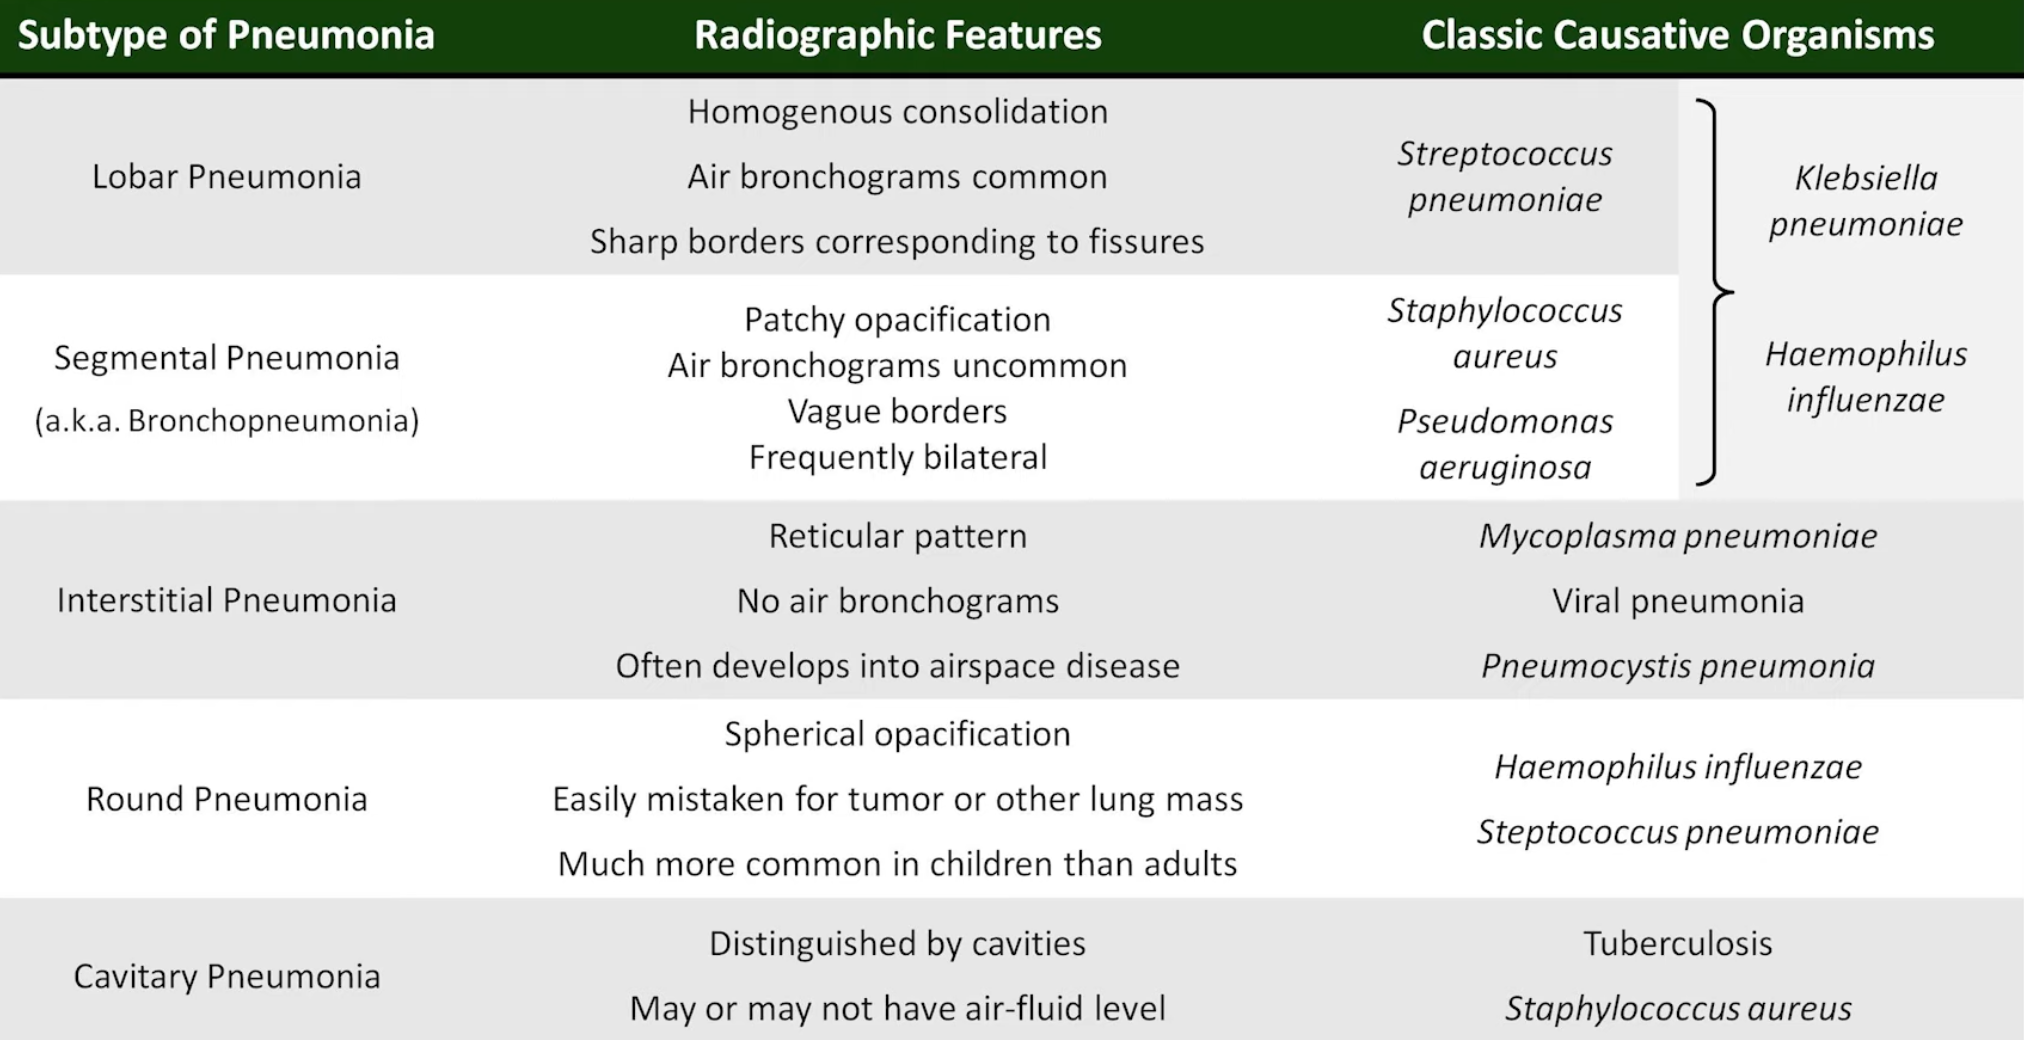
Pneumonia
- Can be identified using
- Silhouette Sign
- Loss of the normally visible border of an intrathoracic structure caused by an adjacent pulmonary density.
- RUL: ascending aorta
- RML: right heart border
- RLL: right diaphragm
- LUL: aortic knob, left heart border (lingula)
- LLL: left diaphragm, descending aorta
- Loss of the normally visible border of an intrathoracic structure caused by an adjacent pulmonary density.
- Spine Sign
Pulmonary Nodules
Well circumscribed, generally round density smaller than 3 cm in diameter.
Pulmonary Embolism
- Most result in no apparent changes on chest X-ray
- Rarely, large PE can result in one of several eponymous findings

Cavitation
- Can be due to pneumonia, lung abscess, tuberculosis, pulmonary metastasis (most common: SCC), septic pulmonary emboli, pulmonary infarct, granulomatosis with polyangiitis, rheumatoid nodules, pneumatocele
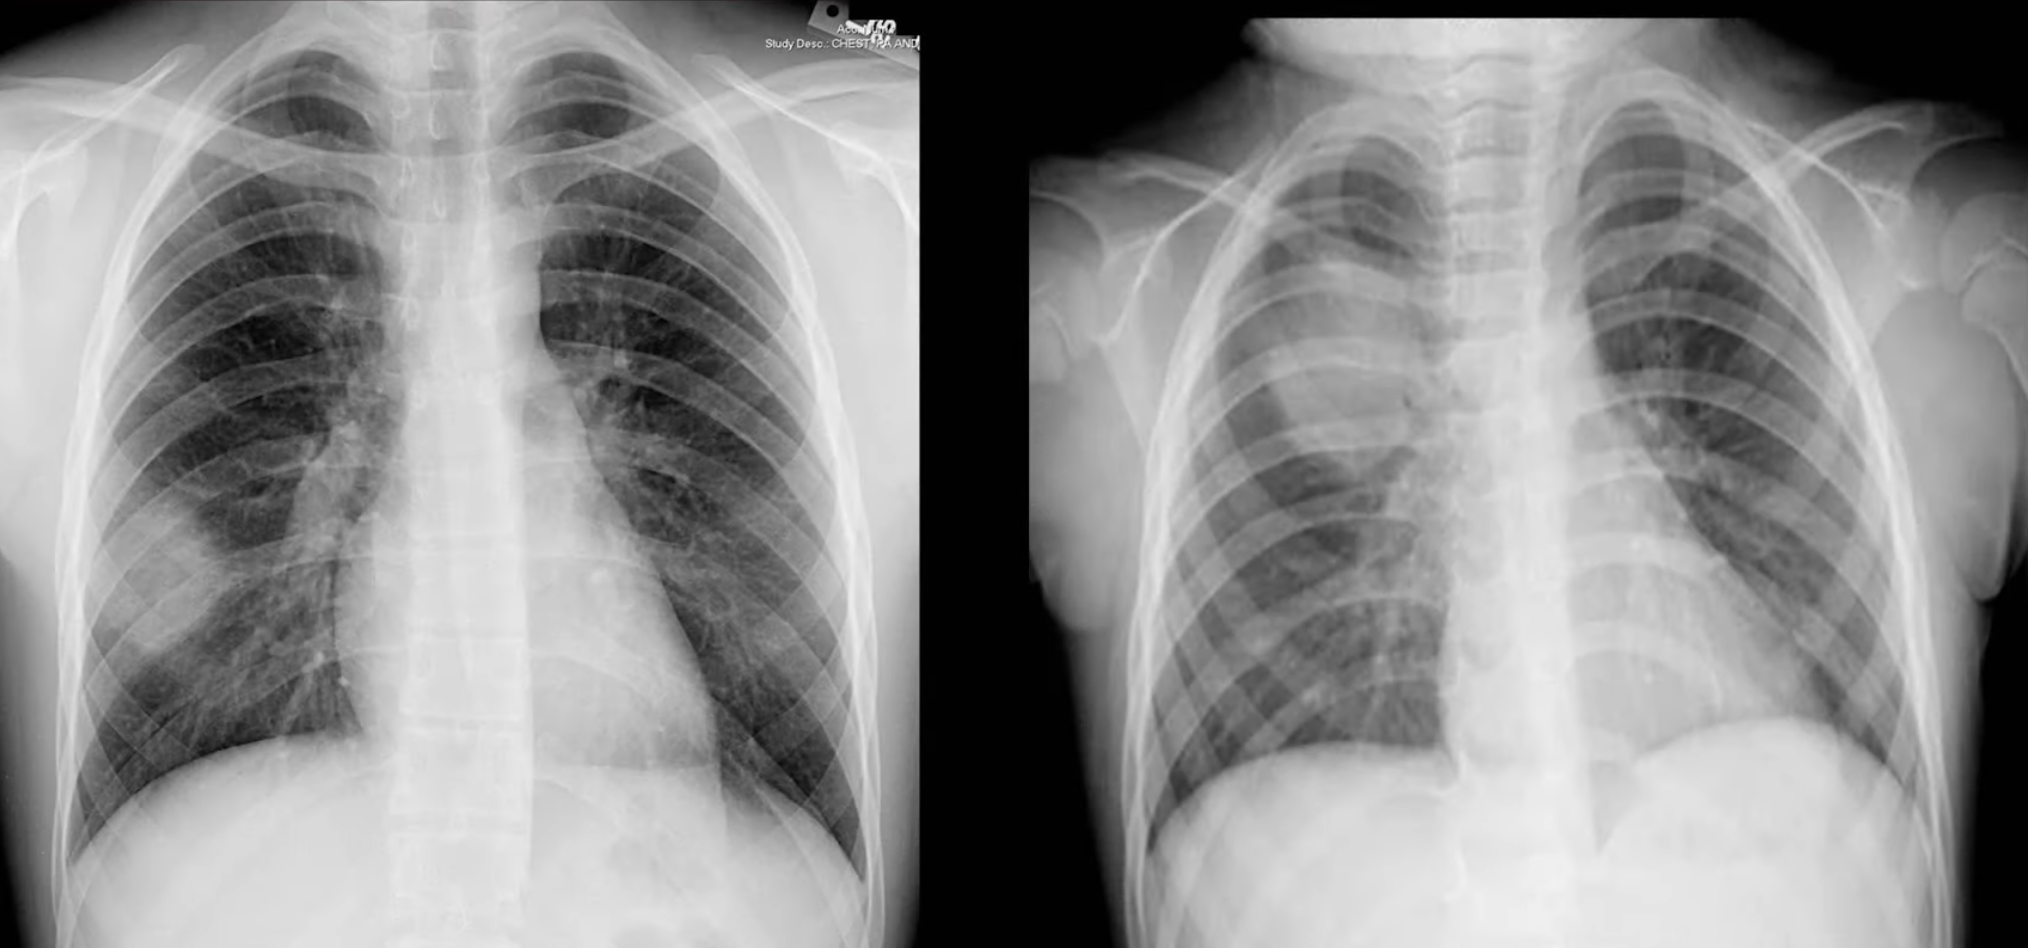
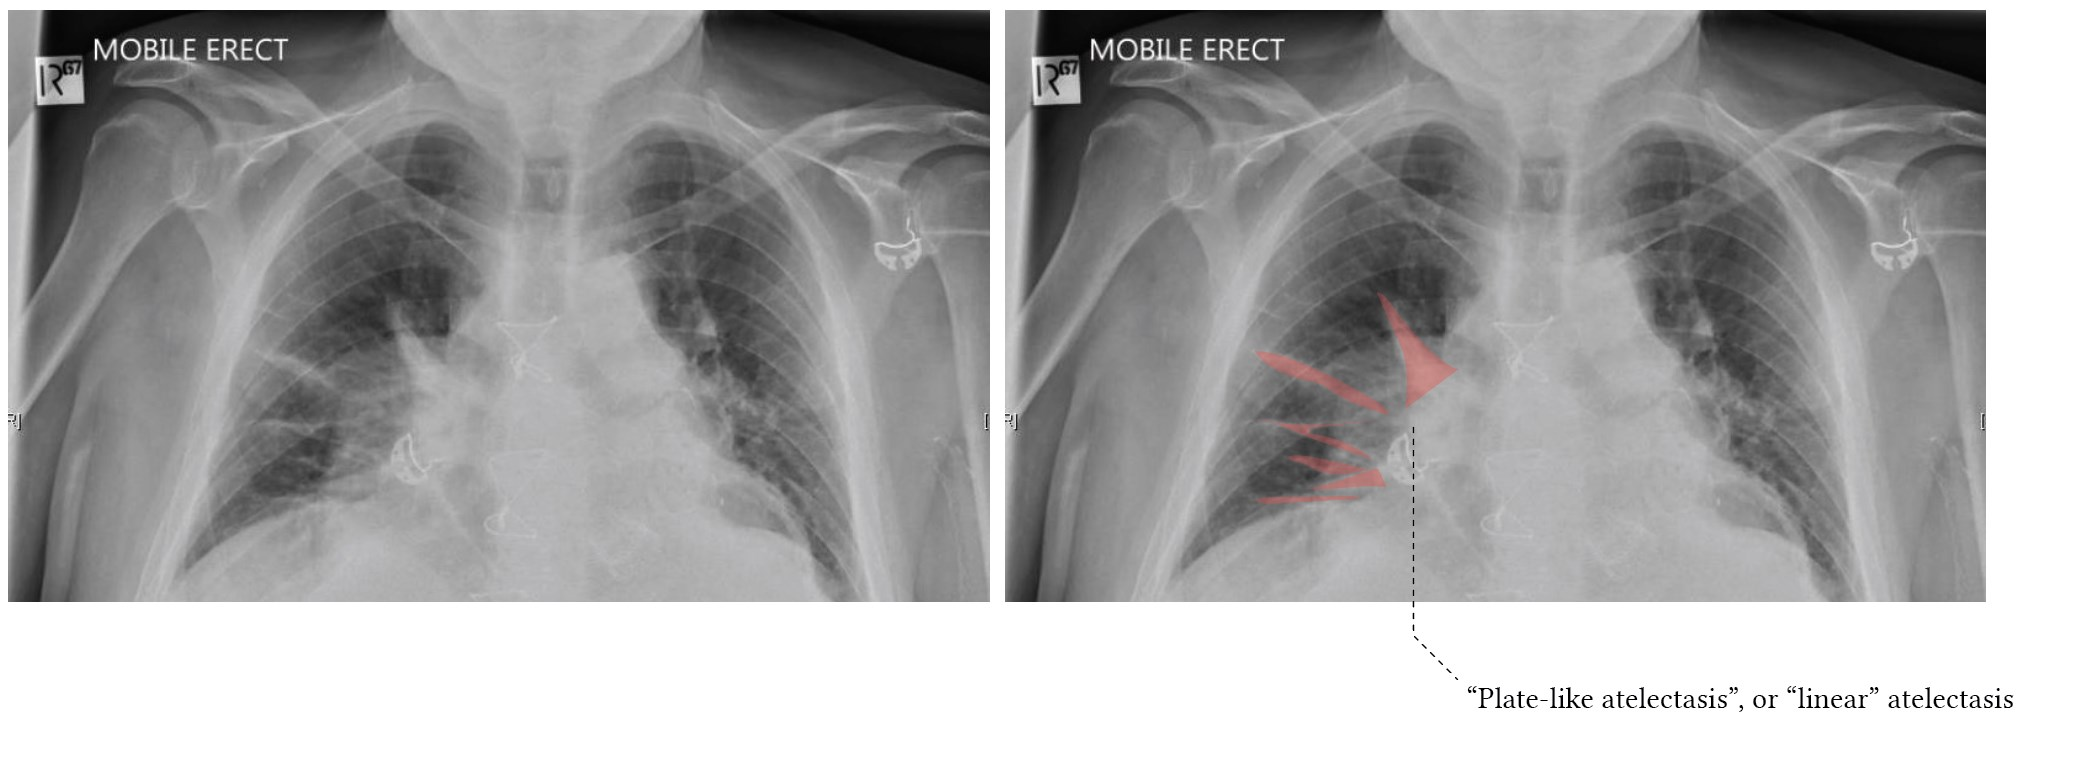
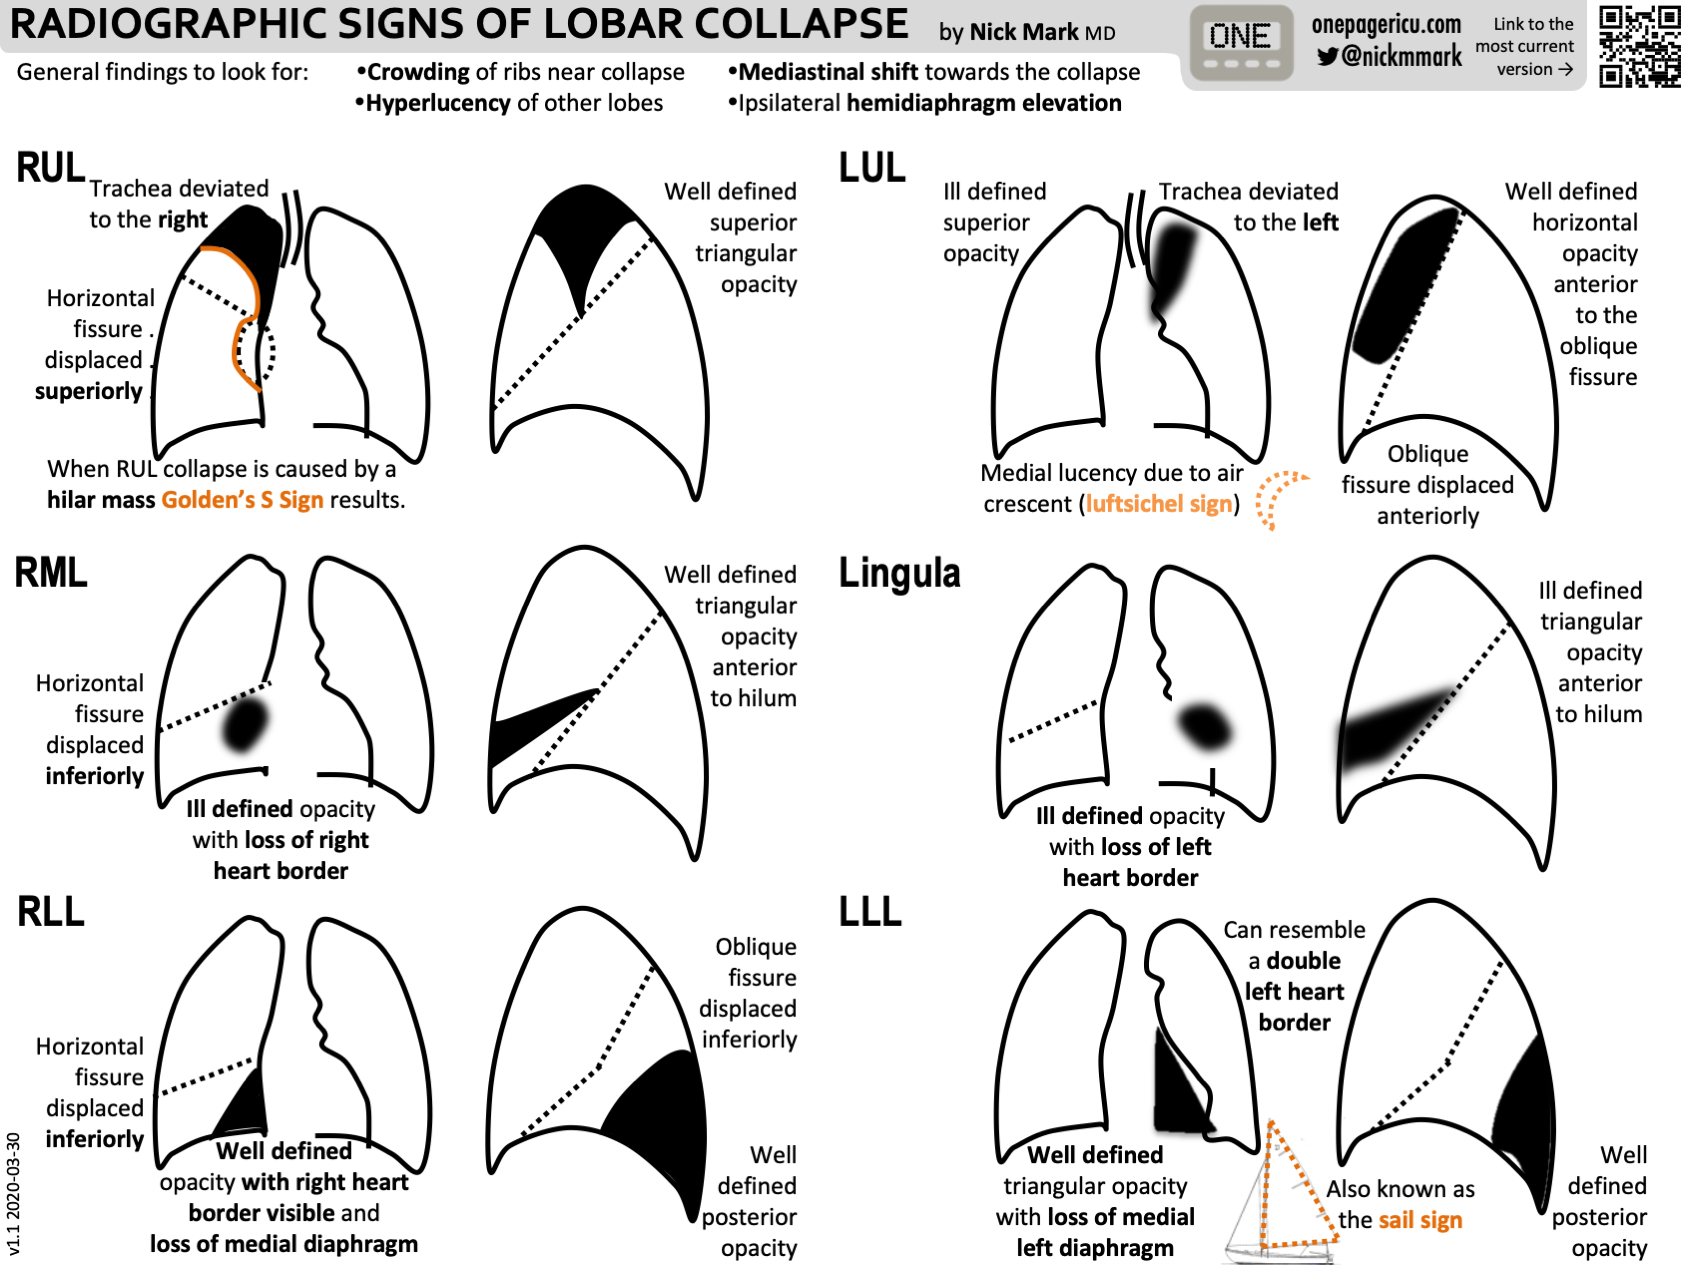
Atelactasis
- Loss of lung volume due to collapse
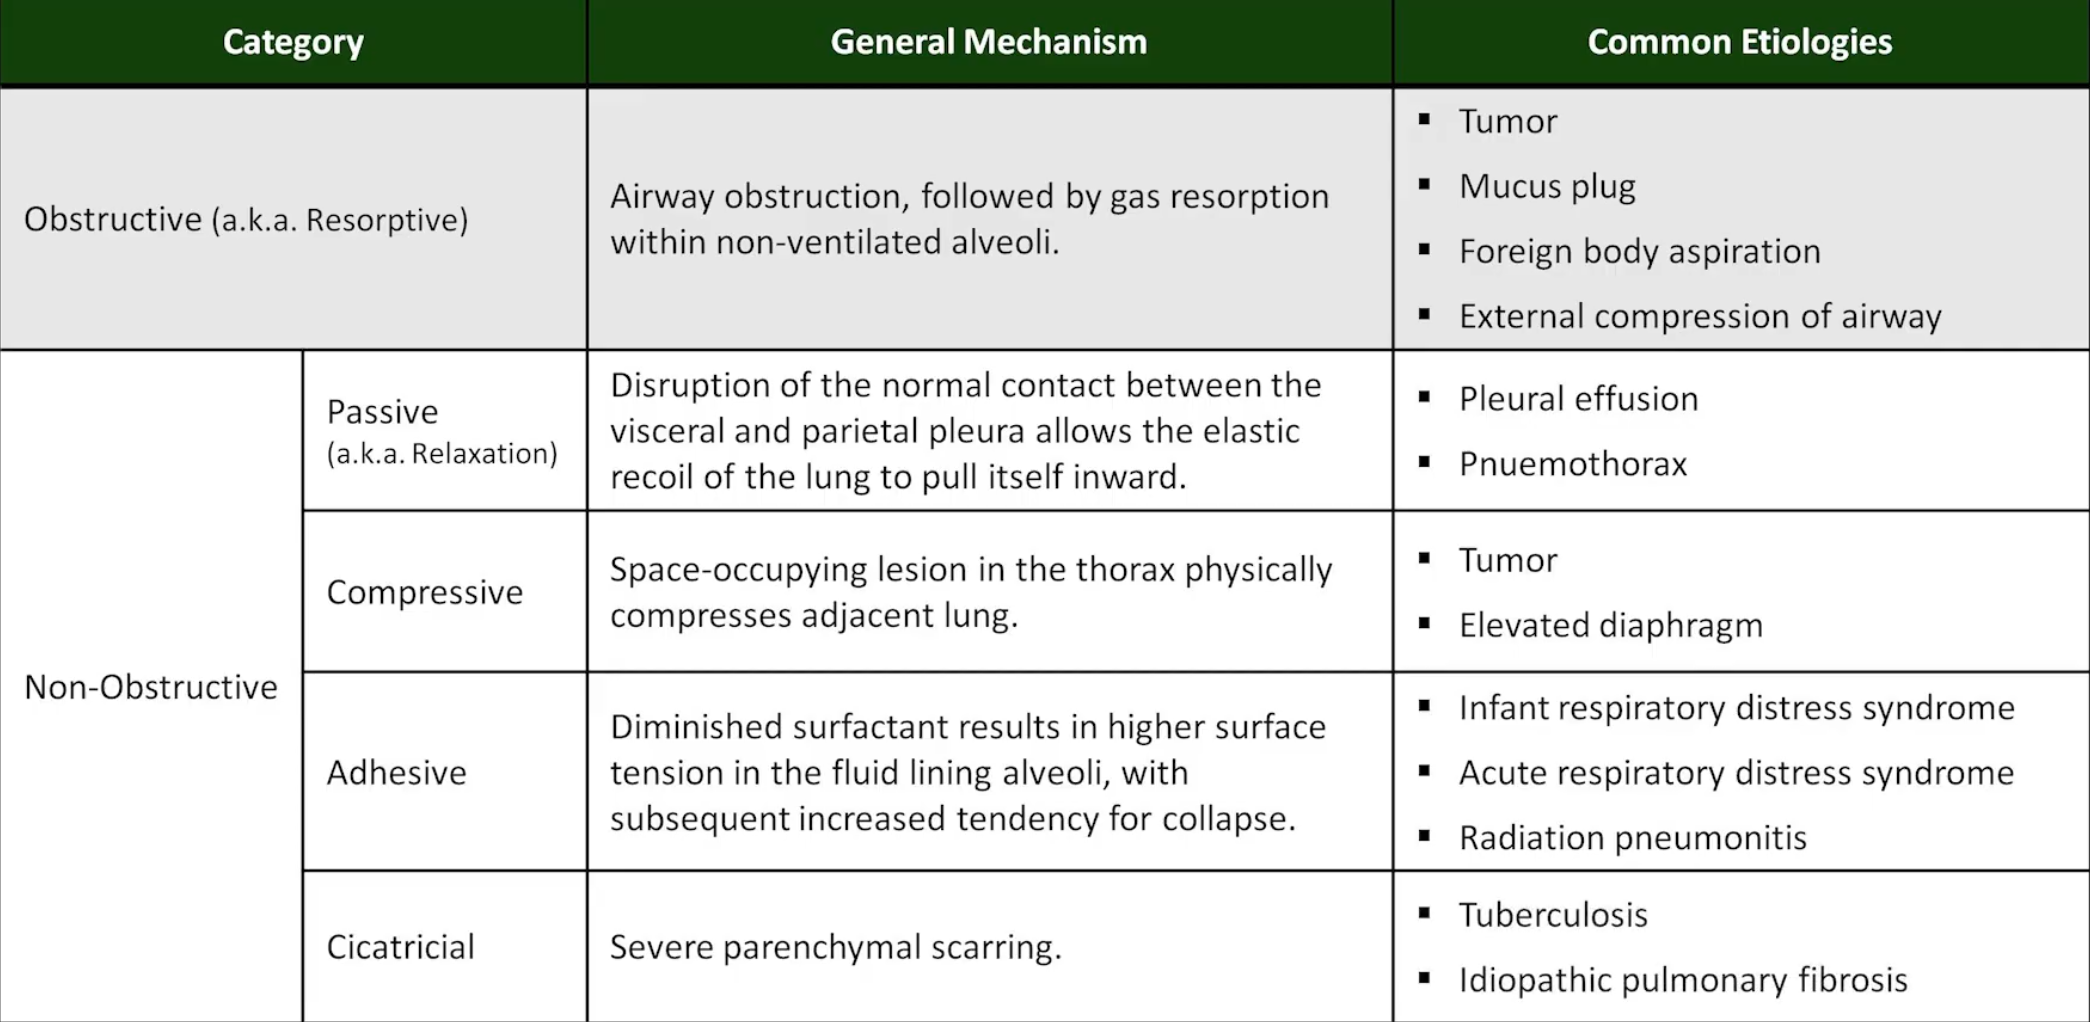
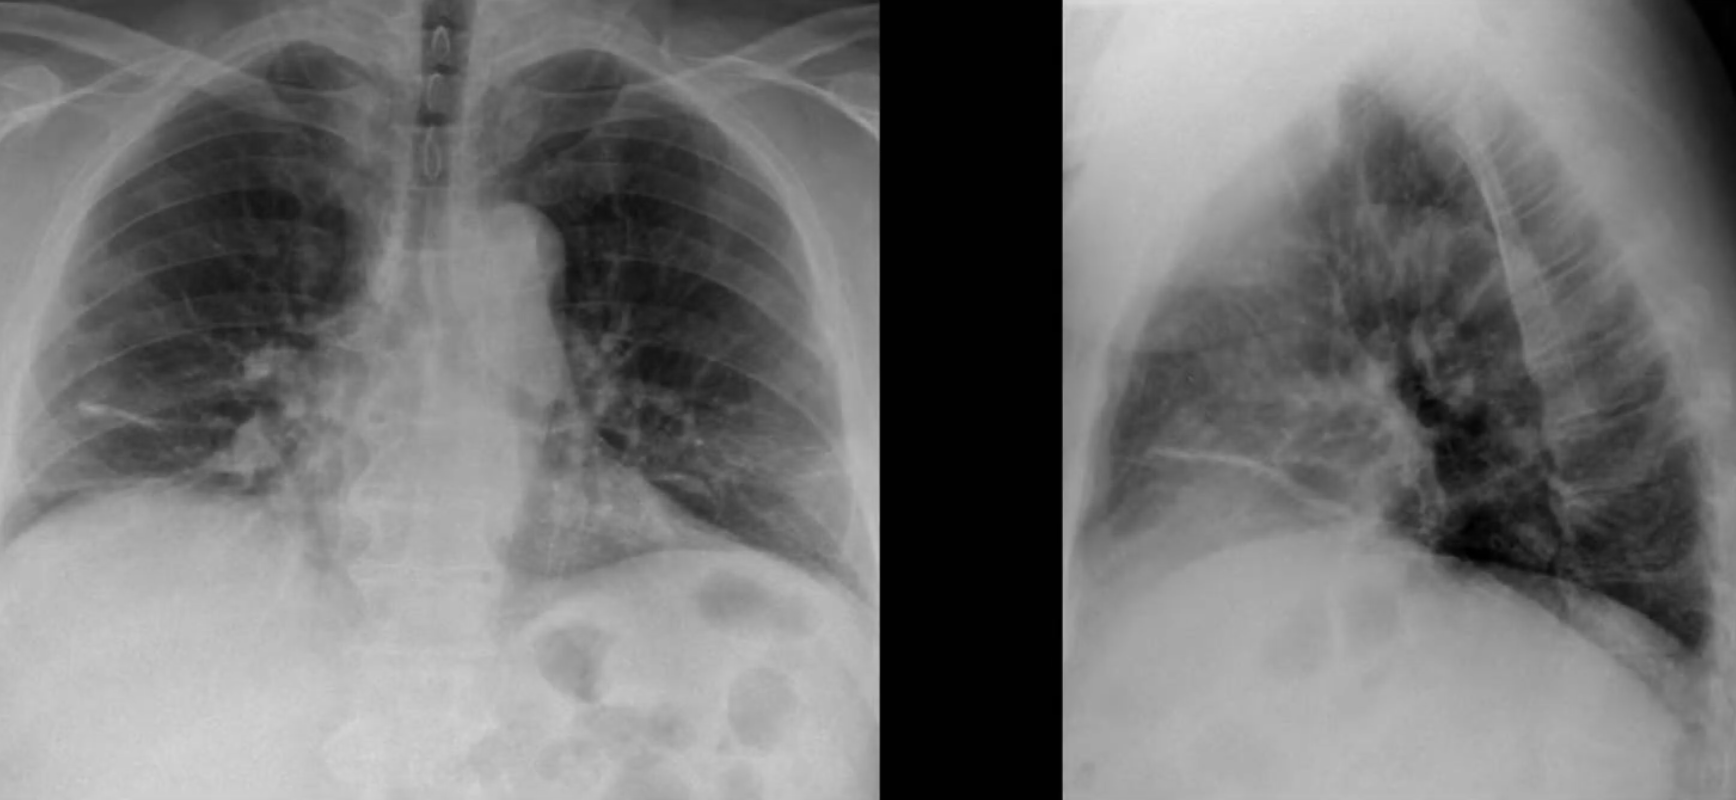
- Lobar atelactasis usually occurs from airway obstruction
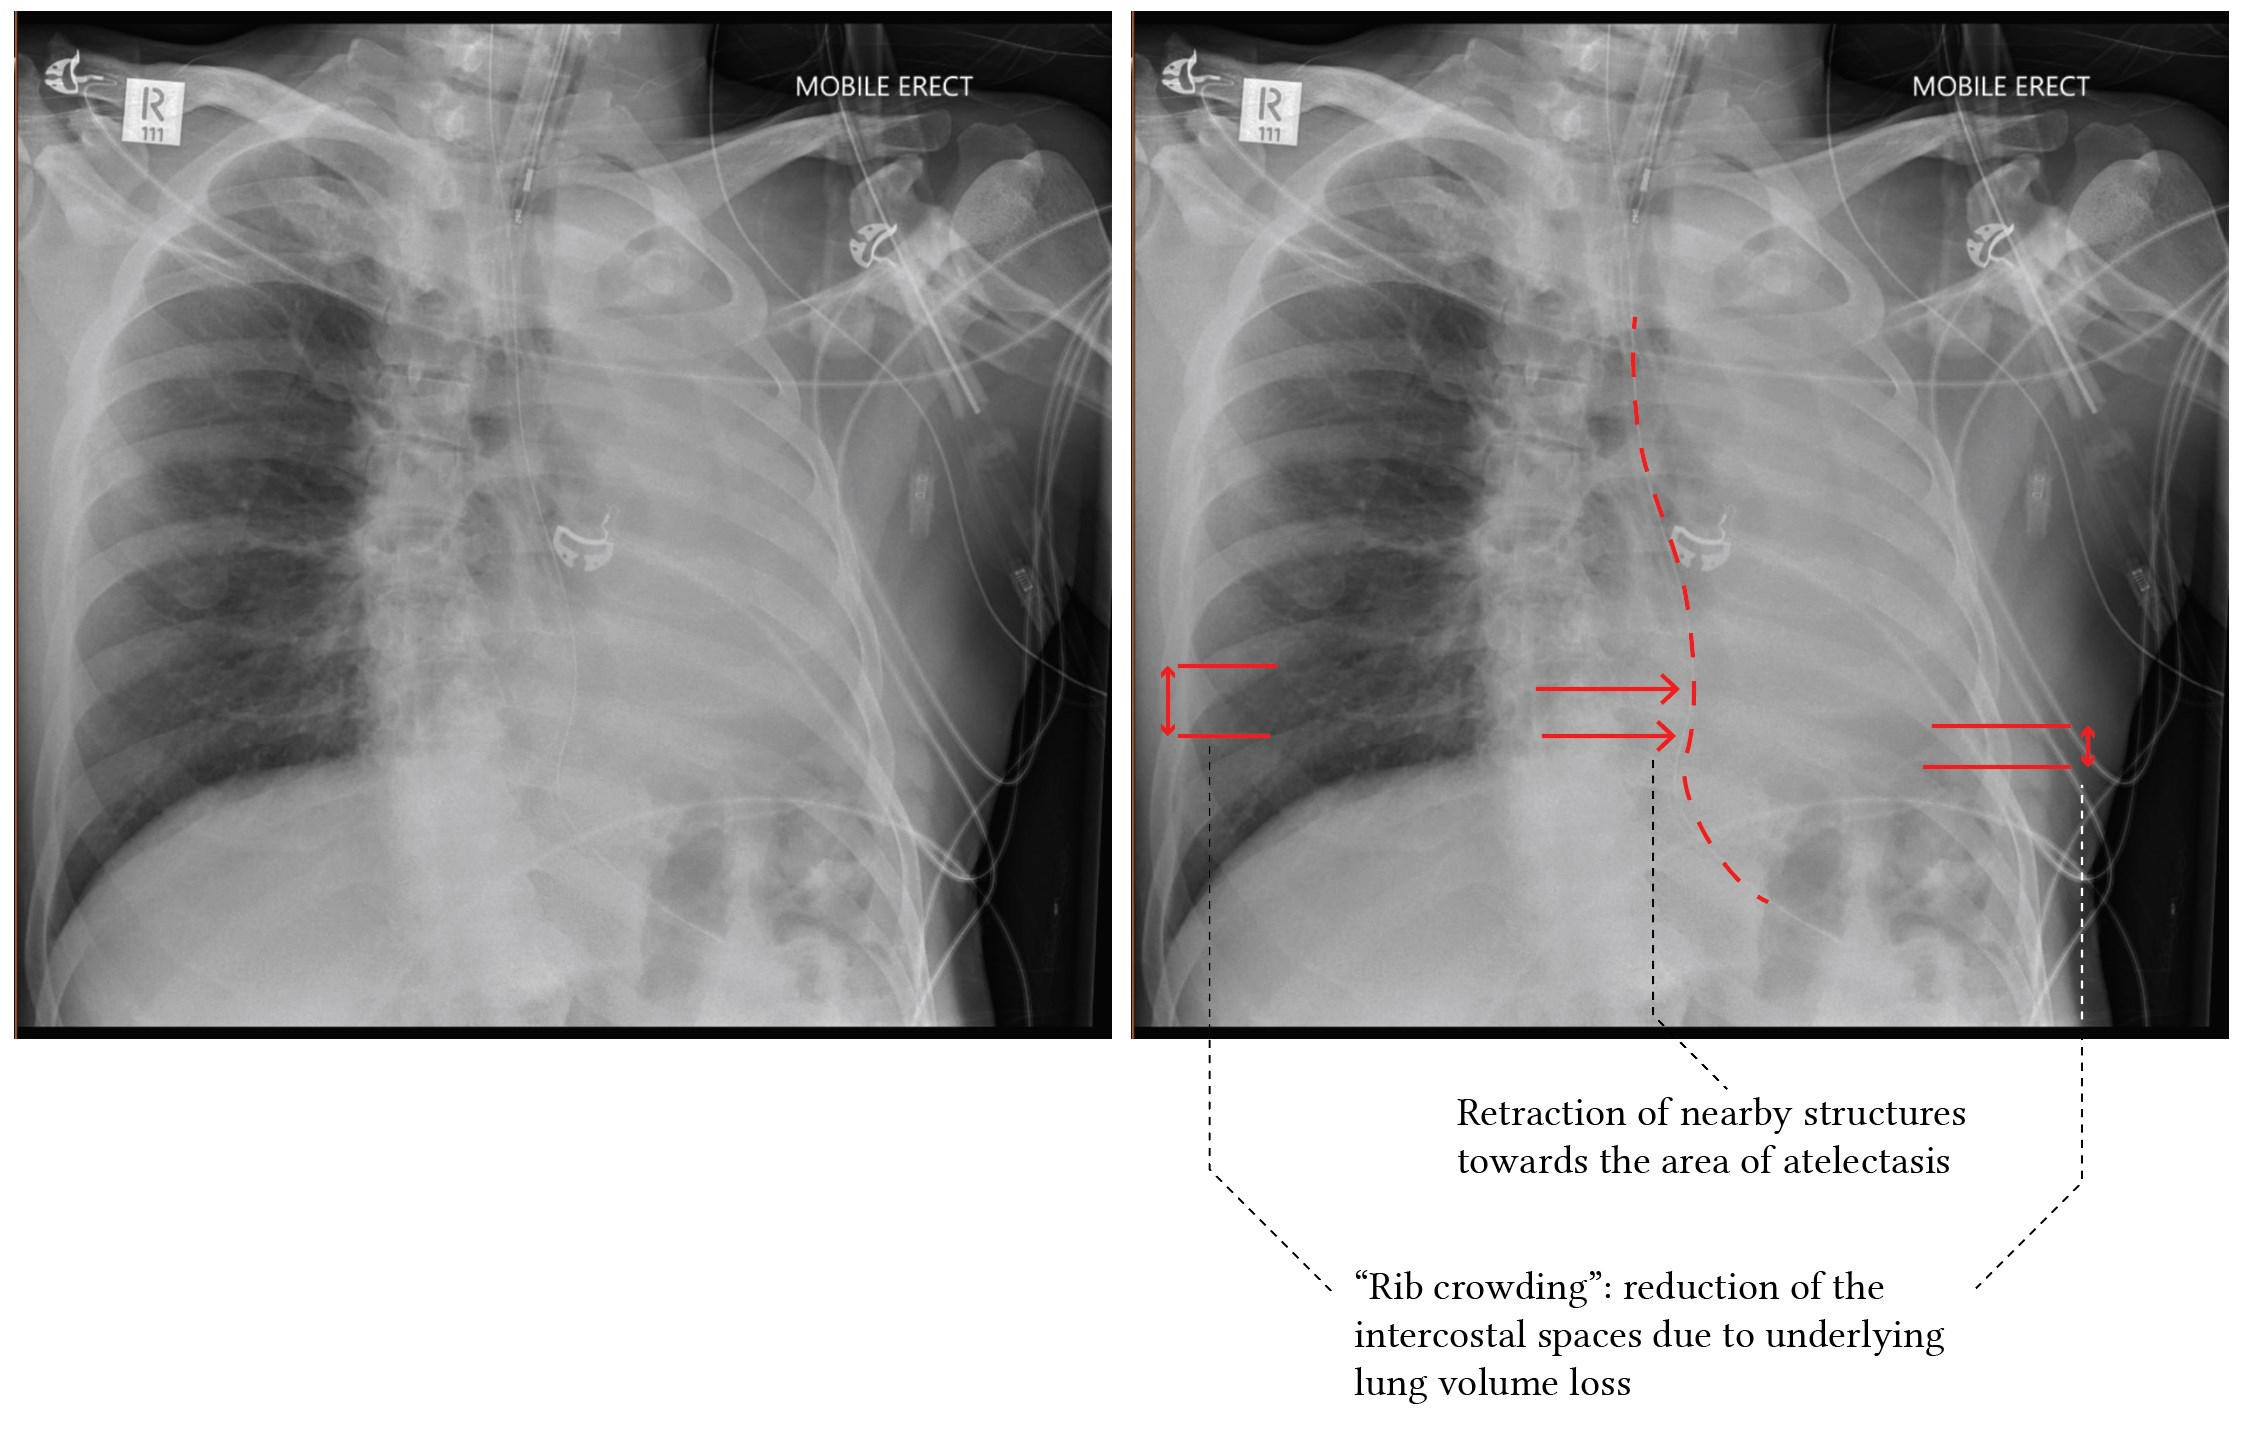
- Findings seen in all anatomic variations of lobar collapse are:
- Elevation of the ipsilateral hemidiaphragm
- Mediastinal shift towards the side of collapse
- Juxtaphrenic peak sign (particularly with upper lobe collapse)
- Findings seen in all anatomic variations of lobar collapse are:
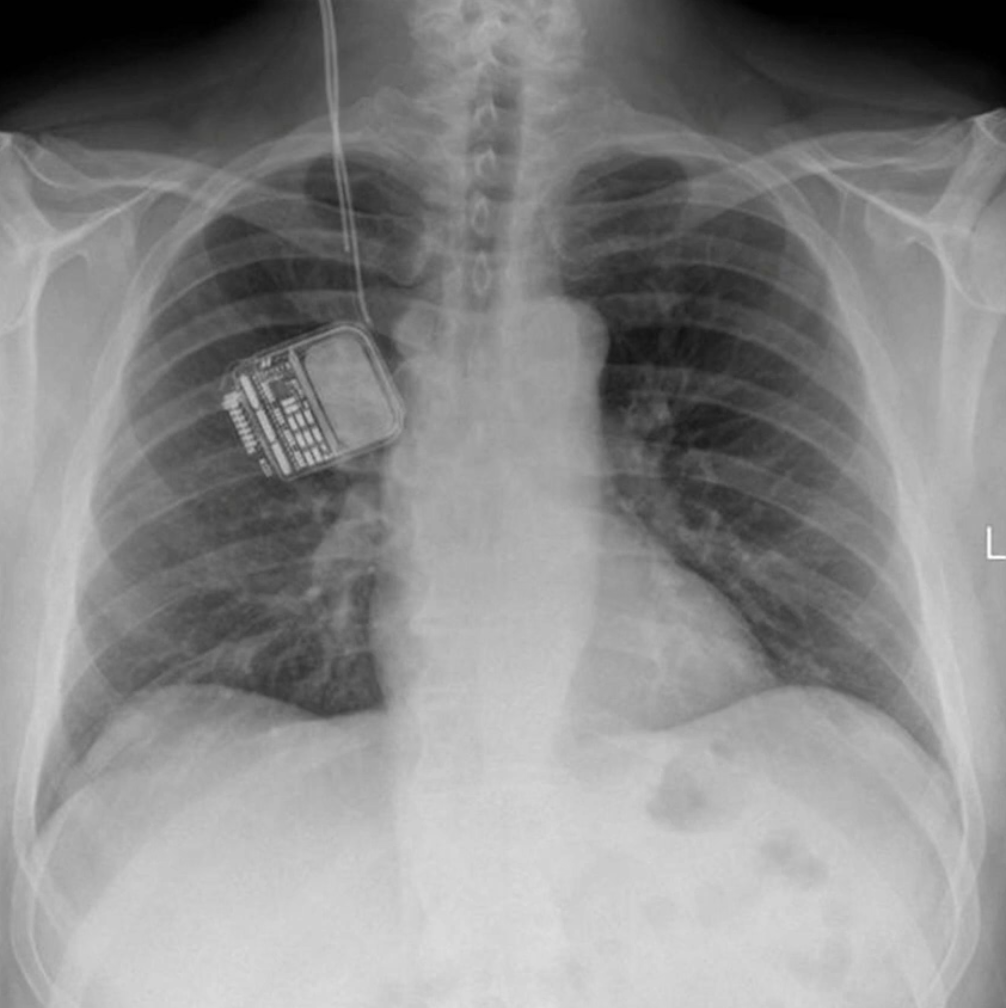
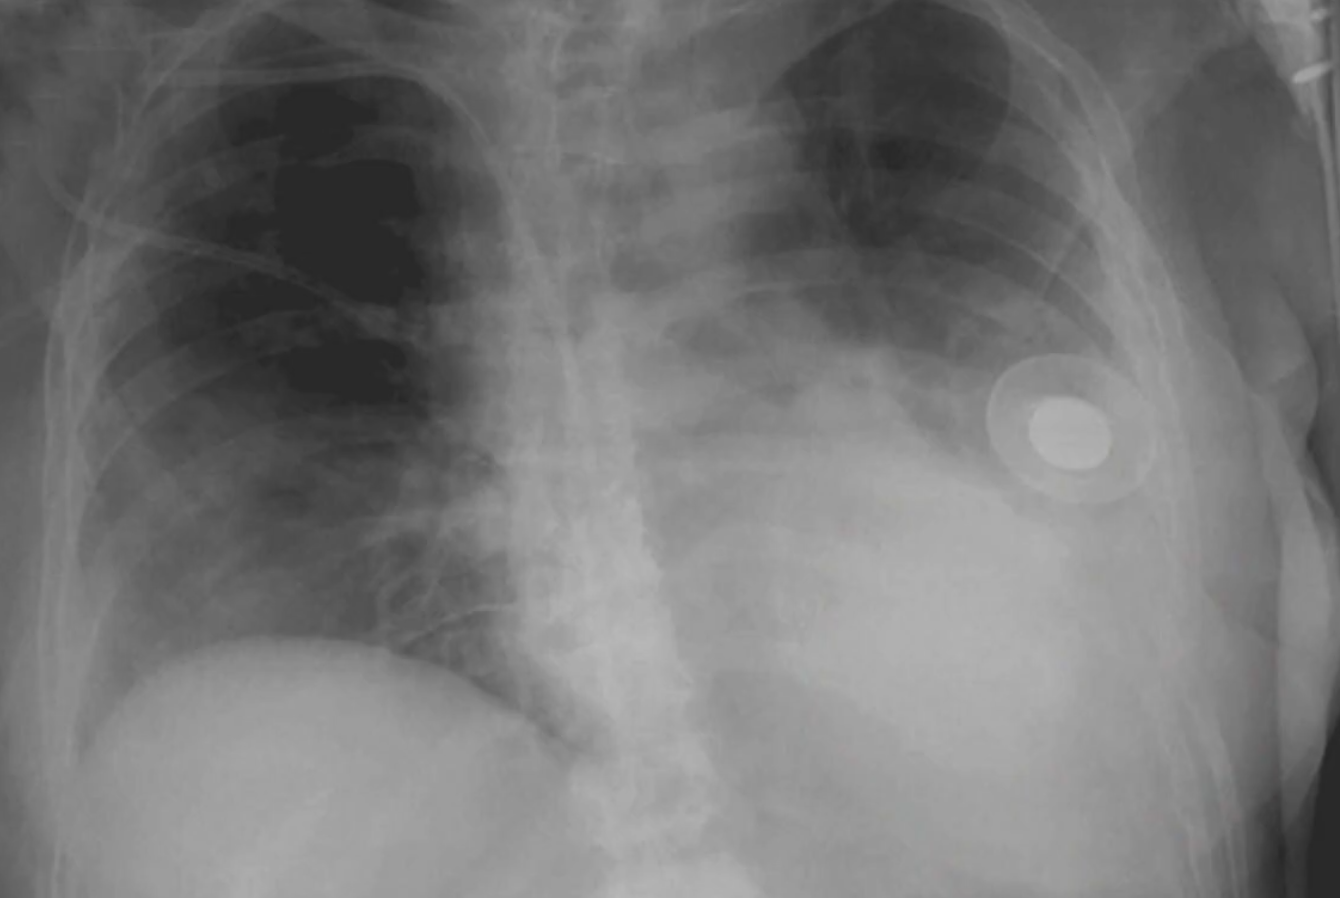
Lines, Tubes, Devices, Surgeries
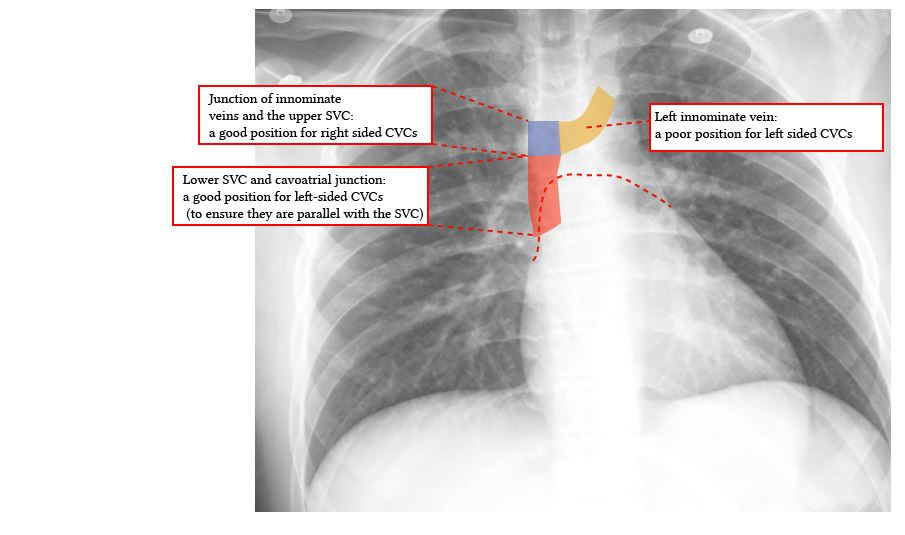
- Optimal placement of a central line and PICC lines places the tip at he junction of the SVC and right atrium
- PA Catheter (Swan-Ganz catheter). Optimal placement places the tip at the level of the hilum, no more than 3 cm right of midline or 1 cm beyond the cardiac silhouette
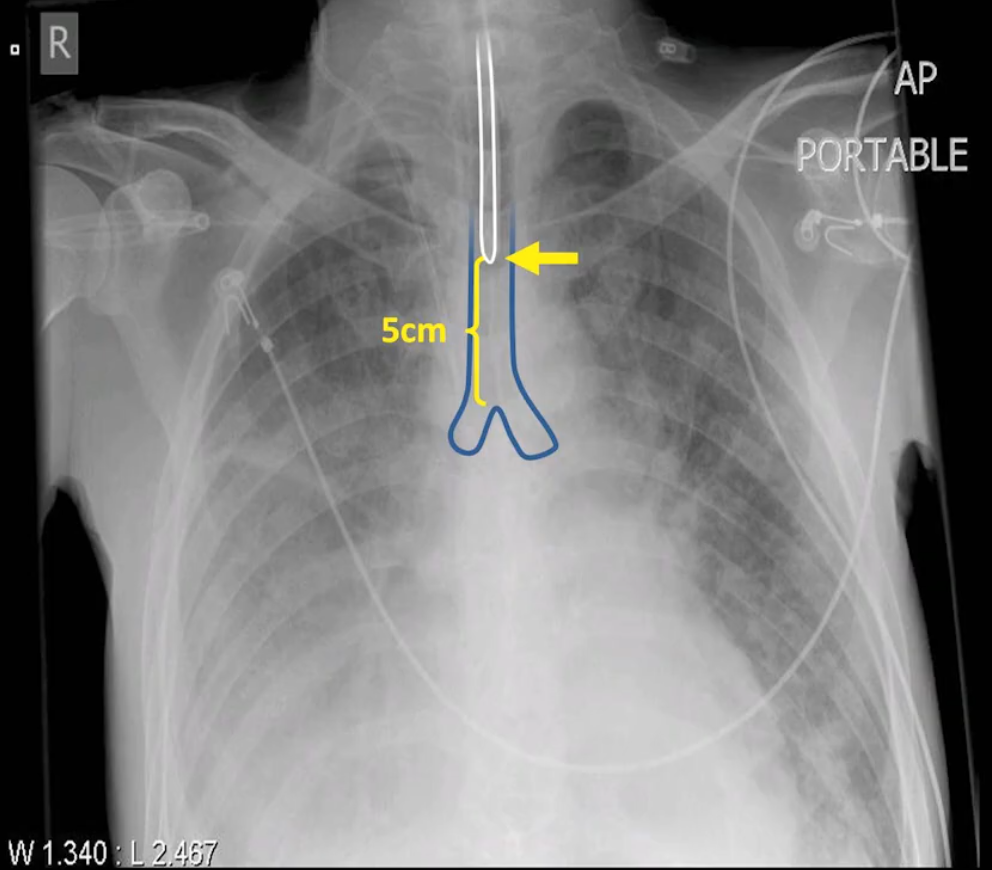
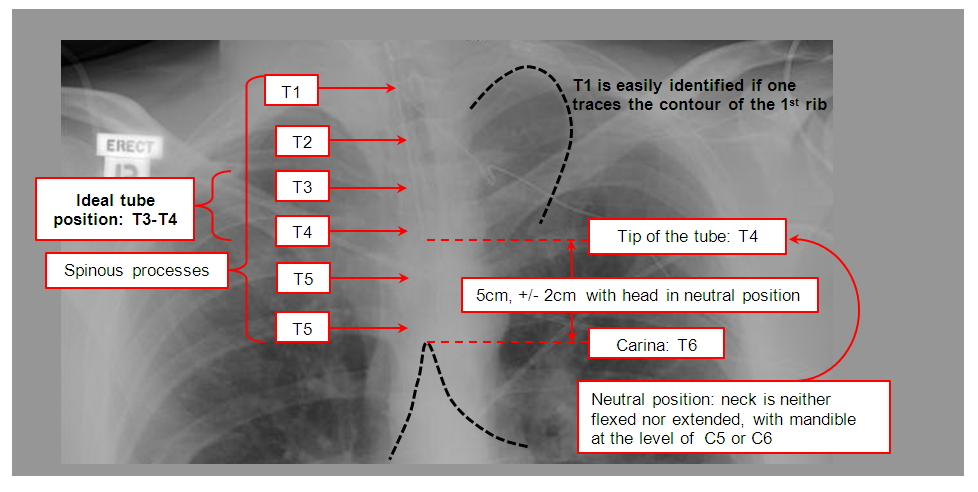
- Proper placement of endotracheal tubes results in the tip being ~5cm above the carina
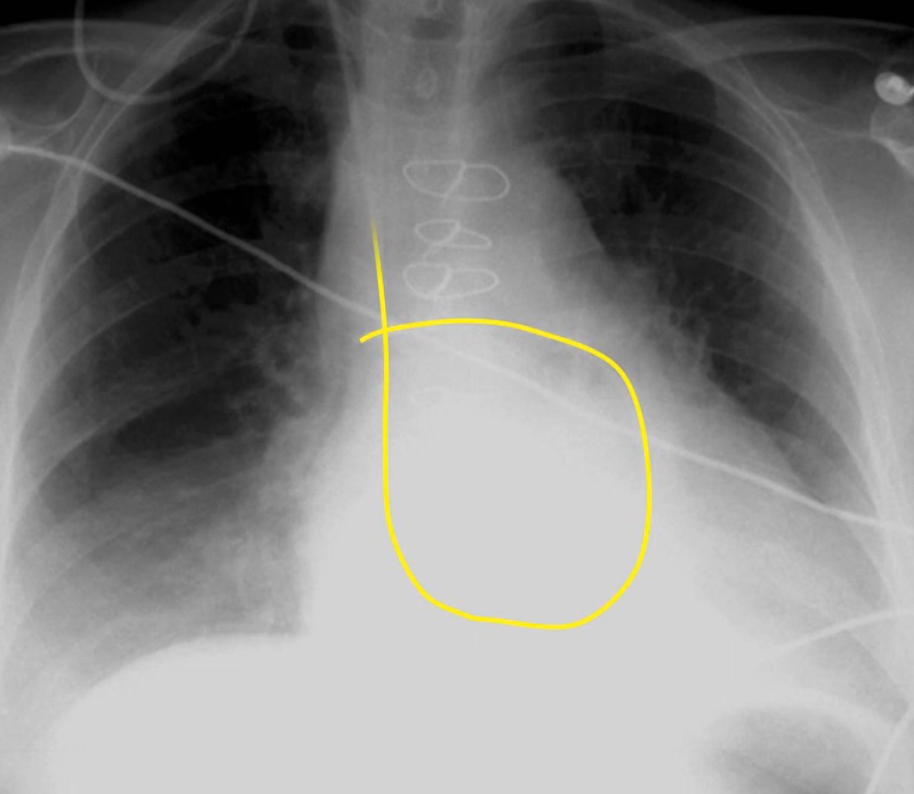
- Nasogastric tube placement is confirmed by:
- Descent through the thorax centrally
- Crossing the diaphragm
- Once below the diaphragm, initially deviates to the left
- Optimally, tip should be >10 cm below the gastroesophageal junction
Other Notes
- The chest X-ray is often performed daily in ICU (Utility of the routine daily chest Xray)