B1.i Explain the single and multiple compartment pharmacokinetic models
Compartment Models
Compartment models describe the body as one or more well-mixed spaces the drug moves between, so that plasma concentrations over time can be described mathematically
The compartments are mathematical rather than anatomical, although they loosely correspond to groups of tissues with similar blood flow
One-Compartment Model
The drug distributes instantly and evenly through a single volume (VD), so after an IV bolus the only process is elimination:
dtdA=−CL⋅C=−k⋅A∴C(t)=C0e−kt,k=VDCL
A plot of log concentration against time is a straight line with slope −k, and extrapolating it back to t=0 gives C0=Dose/VD
Two-Compartment Model
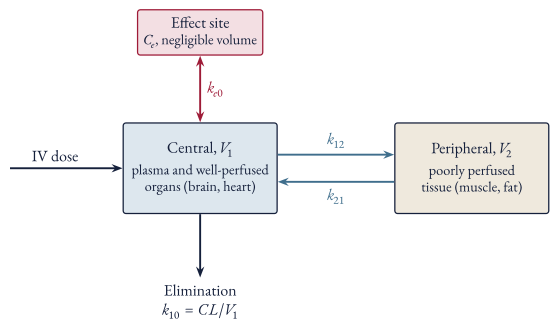
The drug is given into a small central compartment (V1: plasma and well-perfused organs such as the brain, heart, liver and kidney) and distributes to a peripheral compartment (V2: poorly perfused tissue such as muscle and fat)
Elimination is assumed to happen from the central compartment
Figure 1 Two-compartment model with an effect site. Organs adapted from Servier Medical Art, CC BY 4.0
Writing the amount of drug in each compartment as X1 and X2:
The solution after an IV bolus is the sum of two exponentials (biexponential):
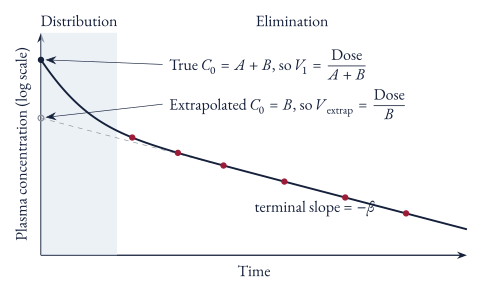
C(t)=Ae−αt+Be−βt,α+β=k10+k12+k21,αβ=k10k21
- **Distribution phase ($\alpha$, fast):** plasma concentration falls steeply as drug moves out to the peripheral compartment, even though little has been eliminated yet
- **Elimination phase ($\beta$, slow):** once the compartments have equilibrated, plasma concentration falls at a rate set by clearance; the elimination (terminal) half-life is $0.693/\beta$
What equation describes plasma concentration after an IV bolus in a two-compartment model, and what does each phase represent?
C(t)=Ae−αt+Be−βt. The fast α phase is distribution from the central to the peripheral compartment; the slow β phase is elimination after the compartments have equilibrated (terminal half-life =0.693/β).
Volumes in a Two-Compartment Model
With two compartments, “the” volume of distribution depends on when it is measured, since the ratio of amount in the body to plasma concentration changes as the drug distributes:
Volume
Formula
Meaning
Central (V1)
A+BDose
Volume at the moment of injection, before any distribution
Steady state (VSS)
V1+V2
Amount in the body divided by plasma concentration at steady state
Area (Varea or Vβ)
βCL=β⋅AUCDose
Relates amount to concentration during the elimination phase
Extrapolated (Vextrap)
BDose
What back-extrapolating the terminal phase gives
In order of size: V1<VSS≤Varea<Vextrap
Back-extrapolating the terminal phase to t=0 gives its intercept (B) rather than the true initial concentration (A+B), which overestimates the volume:
Figure 2 Back-extrapolating the elimination phase
How much it overestimates depends on how fast distribution is compared with elimination. Integrating the biexponential for the AUC:
- When distribution is much faster than elimination ($\alpha\gg\beta$), the $A\beta/\alpha$ term is negligible and $V_{\text{extrap}}\approx V_{\text{area}}$, which is why the one-compartment back-extrapolation is usually good enough
- When distribution is slow or large (e.g. digoxin), the extrapolated volume overestimates
The central volume determines the peak concentration straight after a bolus (Dose/V1), whereas VSS is the one to use for a loading dose
Why does back-extrapolating the terminal phase overestimate the volume of distribution in a two-compartment model?
It gives the intercept of the elimination phase (B) rather than the true initial concentration (A+B), so Vextrap=Dose/B is larger than Varea=Dose/(B+Aβ/α). The error is small when α≫β.
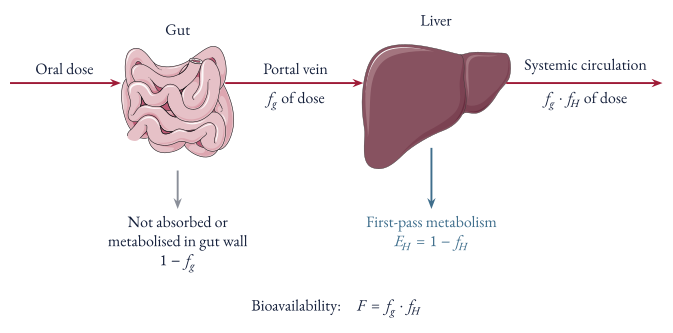
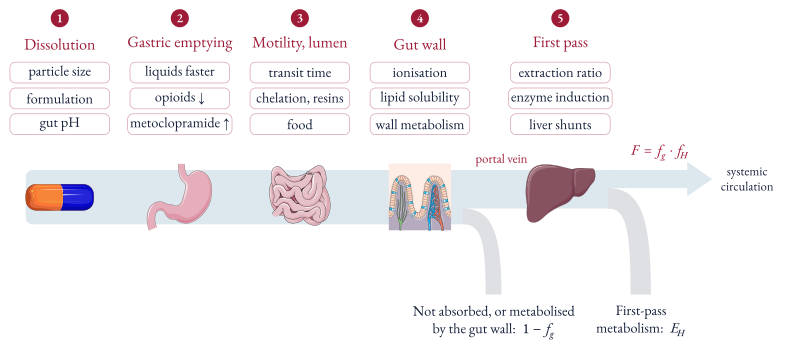
Absorption is the fraction of the dose absorbed intact from the gut into the portal circulation (fg)
First-pass clearance is the extent to which the liver removes the drug on its first passage through the liver in the portal blood, before it reaches the systemic circulation; the fraction escaping it is fH=1−EH
Bioavailability (F) is the fraction of the dose which reaches the systemic circulation as intact drug:
Bioavailability (F)=Fraction Absorbed (fg)×Fraction Escaping First-Pass Clearance (fH)Figure 3 Oral bioavailability and first-pass metabolism. Gut and liver adapted from Servier Medical Art, CC BY 4.0
Two formulations of a drug are bioequivalent if the extent and rate of absorption from them are similar enough that there is no clinically important difference in their effects (either therapeutic or adverse)
What is bioavailability and what determines it?
The fraction of the dose which reaches the systemic circulation as intact drug. It is the fraction absorbed from the gut multiplied by the fraction escaping first-pass clearance by the liver:
F=fg⋅fH,fH=1−EH
When are two formulations of a drug bioequivalent?
When the extent and rate of absorption from them are similar enough that there is no clinically important difference in their therapeutic or adverse effects
Measuring Bioavailability
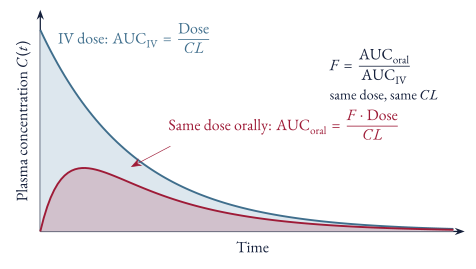
Bioavailability is measured by giving the same dose IV and orally and comparing the area under the plasma concentration versus time curves (AUC); clearance is the same both times, so it cancels:
AUCoralAUCIV∴F=CLF×Dose=CLDose=AUCIVAUCoralFigure 4 Measuring bioavailability from the AUC after the same dose given IV and orally
Similarly, the relative bioavailability of two formulations given by the same route is:
Relative Bioavailability=AUCreferenceAUCtest
How is the absolute bioavailability of a drug measured?
Give the same dose IV and orally and compare the areas under the curve. Since AUC=F⋅Dose/CL and clearance is the same both times:
F=AUCIVAUCoral
Determinants of Drug Absorption
Figure 5 Determinants of oral absorption and first-pass clearance along the path of a dose. Capsule, stomach, gut and liver adapted from Servier Medical Art, CC BY 4.0
Dissolution: properties of the drug including particle size and form, excipients, special dosage forms (e.g. sustained release), and stomach and small intestine pH
Gastric emptying rate: affects how long the drug sits in acid (which matters for drugs unstable at acid pH) and how soon it reaches the small intestine; liquids and small particles empty more quickly than solid dosage forms, and emptying is slowed or sped up by antacids, drugs (opioids and anticholinergics slow it, metoclopramide speeds it up) and disease (e.g. autonomic neuropathy)
Intestinal motility: affects how long slowly soluble drugs (e.g. digoxin, sustained release formulations) have to dissolve, and how long the drug is exposed to chemical degradation or metabolism by gut flora
Drug interactions in the gut lumen: complexation (e.g. tetracyclines with divalent metal ions), adsorption (e.g. anion exchange resins), and interactions with food (e.g. some antibiotics)
Passage through the gut wall: physicochemical characteristics of the drug (e.g. quaternary ammonium compounds are permanently charged so cross poorly), and metabolism by enzymes in the intestinal epithelium
What determines how well a drug is absorbed from the gut?
Dissolution, gastric emptying rate, intestinal motility, interactions in the gut lumen (complexation, adsorption, food) and passage through the gut wall (physicochemical properties of the drug and metabolism by the intestinal epithelium)
Determinants of oral absorption and first-pass clearance along the path of a dose. Capsule, stomach, gut and liver adapted from Servier Medical Art, CC BY 4.0
Determinants of First-Pass Clearance
In low hepatic extraction ratio drugs (e.g. theophylline), nearly all of the dose gets through the liver on its first pass (fH≈1), so F≈fg
Doubling or halving the small fraction the liver extracts makes little difference to F, e.g. EH rising from 0.1 to 0.2 only lowers fH from 0.9 to 0.8
In high hepatic extraction ratio drugs (e.g. verapamil), only a minor proportion of the dose reaches the systemic circulation intact
Inducing or inhibiting the metabolising enzymes has only a small effect on the hepatic extraction ratio, and so on systemic clearance (CL≈QH), but has a major effect on the proportion escaping extraction (fH), and so a major effect on bioavailability, e.g. EH falling from 0.95 to 0.90 doubles fH from 0.05 to 0.10
Hepatic blood flow does change bioavailability in these drugs, as fH=QH+fu⋅CLintQH≈fu⋅CLintQH, but it changes systemic clearance (≈QH) by the same proportion, so the two cancel and the steady state concentration after oral dosing is unaffected (see Figure 1)
In chronic liver disease, a substantial portion of the portal circulation doesn’t perfuse functional liver because of intrahepatic functional shunts or extrahepatic anatomical shunts, which increases bioavailability markedly; hence high hepatic extraction ratio drugs given to patients with liver disease are particularly liable to cause adverse effects
Cloze
In a low hepatic extraction ratio drug, bioavailability is set mostly by ==absorption from the gut (fg)==, since nearly all of the absorbed dose escapes first-pass clearance
Why does enzyme induction or inhibition change the bioavailability of a high extraction drug much more than its clearance?
Clearance is close to hepatic blood flow, so it barely moves. The fraction escaping first-pass (fH=1−EH) is small, so a small change in EH is a large proportional change in fH, e.g. EH falling from 0.95 to 0.90 doubles fH (0.05 to 0.10) and so doubles F
Why does chronic liver disease increase the bioavailability of high extraction drugs?
Intrahepatic functional shunts and extrahepatic anatomical (portosystemic) shunts let portal blood bypass functioning liver, so more of the dose escapes first-pass extraction. These drugs are therefore more likely to cause adverse effects in liver disease
References
1.
Birkett DJ. Pharmacokinetics made easy. 2.ed., rev. ed. Sydney London: McGraw-Hill; 2005. 131 p.
Volume of distribution is the apparent volume the drug would have to be dissolved in to give the measured plasma concentration, and is defined as the amount of drug in the body divided by the plasma concentration:
Volume of Distribution (VD)=Plasma Drug Concentration (C)Amount of Drug in Body (Abody)
- Immediately after an IV bolus, before any drug has been eliminated, the amount in the body is the dose, hence $V_{D}=\text{Dose}/C_{0}$
- It is an apparent volume rather than a real one, so it can be far larger than total body water (e.g. digoxin, amiodarone)
The volume of distribution depends on where the drug sits, which mostly comes down to binding:
If a drug is tightly bound to plasma proteins (e.g. warfarin), most of it stays in the plasma, so the plasma concentration is high and it will appear as though the medication is dissolved in a smaller volume
If a drug is bound to tissue (e.g. digoxin to muscle, amiodarone to fat), little of it is left in the plasma, so the plasma concentration is low and the volume appears very large
For reference, in a 70 kg adult plasma is about 3 L, extracellular fluid about 14 L and total body water about 42 L, so:
VD
Interpretation
Examples (approximate)
≈ Plasma volume
Mostly confined to plasma (highly protein bound or very large molecules)
Warfarin ≈ 0.1 L/kg, heparin
≈ Extracellular fluid
Polar drugs that cross capillaries but not cell membranes
Gentamicin ≈ 0.25 L/kg
≈ Total body water
Small lipid soluble drugs distributed evenly
Ethanol ≈ 0.6 L/kg
≫ Total body water
Concentrated in tissue
Digoxin ≈ 7 L/kg, amiodarone ≈ 60 L/kg
What is the definition of volume of distribution?
The amount of drug in the body divided by the plasma drug concentration (VD=Abody/C). It is an apparent volume, so it can exceed total body water.
Cloze
A drug highly bound to plasma proteins (e.g. warfarin) has a small volume of distribution, whereas a drug highly bound to tissue (e.g. digoxin) has a large volume of distribution
Plasma and Tissue Binding
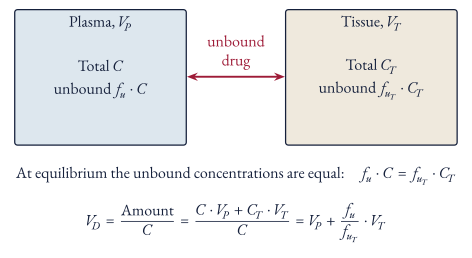
The components of volume of distribution are the plasma volume and the tissue volume, weighted by the ratio of the fraction of the drug unbound in plasma to the fraction of the drug unbound in tissue:
VD=Plasma Volume (VP)+Fraction unbound in tissue (fuT)Fraction unbound in plasma (fu)×Tissue Volume (VT)
This comes from splitting the amount in the body into what is in the plasma and what is in the tissue, then using the fact that only unbound drug crosses between them, so at equilibrium the unbound concentrations are equal:
fu⋅CVD=CAbody=fuT⋅CT∴CT=fuTfu⋅C=CC⋅VP+CT⋅VT=VP+fuTfu⋅VTFigure 6 Volume of distribution from plasma and tissue binding. Artery, muscle and fat adapted from Servier Medical Art, CC BY 4.0
Hence:
More plasma protein binding (lower fu) shrinks VD towards VP
More tissue binding (lower fuT) makes VD larger, without limit
Derive volume of distribution in terms of plasma and tissue binding
Only unbound drug equilibrates, so fu⋅C=fuT⋅CT. Then VD=CC⋅VP+CT⋅VT=VP+fuTfu⋅VT
Factors Affecting Volume of Distribution
Drug factors:
Lipid solubility: lipid soluble drugs cross membranes and distribute into fat, polar drugs stay largely extracellular
Ionisation (pKa relative to the local pH): only the unionised form crosses membranes
Plasma protein and tissue binding (see above)
Molecular size: very large molecules (e.g. heparin) stay in the plasma
Patient factors:
Body composition: obesity increases VD for lipophilic drugs, and neonates have a larger proportion of body water
Fluid status: fluid resuscitation, oedema and capillary leak in critical illness increase VD for hydrophilic drugs (e.g. aminoglycosides, β-lactams)
Plasma proteins: hypoalbuminaemia increases fu and hence VD for drugs bound to albumin
Pregnancy increases plasma volume and body water
Renal failure: uraemia reduces tissue binding of digoxin, so its VD falls from about 7 L/kg to about 4–5 L/kg and the loading dose has to be reduced, even though clearance doesn’t enter the loading dose calculation (see Loading in Renal Impairment)
Measuring Volume of Distribution
Serial plasma concentrations are taken after an IV bolus and plotted as log concentration against time
The line of best fit is extrapolated to t=0 to find the plasma concentration at time zero (C0)
This is used to calculate the volume of distribution (VD=C0Dose)
This assumes a one-compartment model, i.e. that the drug distributes instantly
Most drugs take time to distribute, so the samples are taken after distribution is complete and the extrapolated C0 is lower than the true initial concentration, which overestimates VD (see Volumes in a Two-Compartment Model)
Volume of distribution can also be calculated from clearance and the elimination rate constant (k), using the AUC (see Elimination Rate Constant):
VD=kCL=k⋅AUCDose
Clinical Significance
Loading dose: the amount of drug needed to fill the volume of distribution to a target concentration straight away, rather than waiting about 4–5 half-lives for steady state:
Loading Dose=VD×Target Plasma Concentration
- The loading dose depends only on $V_{D}$, whereas the maintenance dose depends only on clearance ($DR=CL\times C_{SS}$)
- For an oral loading dose, divide by the bioavailability ($F$)
Half-life: for a given clearance, a larger volume means a longer half-life, since less of the drug is in the plasma where the clearing organs can reach it:
t1/2=CL0.693⋅VD
Dialysis and haemofiltration remove little of a drug with a large VD, since only a small fraction of the total amount is in the plasma at any time
Plasma concentrations can also rebound after a session as drug redistributes back out of the tissues
Critical illness: fluid shifts and hypoalbuminaemia increase VD for hydrophilic drugs, so a larger loading dose is often needed even though the maintenance dose depends on clearance
How is a loading dose calculated, and why does it not depend on clearance?
Loading Dose=VD×Target Concentration (divided by F if oral). It only has to fill the volume of distribution to the target once; clearance determines the maintenance dose needed to replace what is eliminated.
Why does the digoxin loading dose need reducing in renal failure, if loading dose doesn't depend on clearance?
Uraemia reduces digoxin’s tissue binding, so VD falls (about 7 → 4–5 L/kg). Since LD=VD×target, the load drops by about 30–50% in severe CKD or ESRD. The maintenance dose needs a much larger cut, because clearance is about 70% renal.
Why are drugs with a large volume of distribution poorly removed by dialysis?
Only a small fraction of the total amount in the body is in the plasma, which is all that dialysis can reach. Concentrations can also rebound afterwards as drug redistributes from the tissues.
References
1.
Birkett DJ. Pharmacokinetics made easy. 2.ed., rev. ed. Sydney London: McGraw-Hill; 2005. 131 p.
Elimination refers to the irreversible excretion of unchanged drug or conversion to a metabolically inactive product
Clearance refers to the efficiency of elimination and is broadly defined as a volume of plasma that is cleared of the drug per unit time (L/hr or mL/min)
Quantity
Definition
Units
Elimination rate
Amount of drug irreversibly removed per unit time
mg/hour
Clearance (CL)
Elimination rate divided by plasma concentration
L/hour
Extraction ratio (E)
Fraction of drug entering an organ that is removed in a single pass
none (0 to 1)
Elimination rate constant (k)
Elimination rate divided by the amount of drug in the body
hour⁻¹
Volume of distribution (VD)
Amount of drug in the body divided by plasma concentration
L
Half life (t1/2)
Time for the plasma concentration to fall by half
hour
Definitions
Elimination Rate
If A(t) is the amount of drug eliminated by time t, the elimination rate is how fast that amount grows:
Elimination Rate=dtdA(t)(mg/hour)
Clearance
Clearance is defined as the elimination rate divided by the plasma concentration:
The reason clearance is defined as a ratio is that in first-order (linear) kinetics the elimination rate is proportional to concentration, so the ratio stays constant regardless of dose or concentration and describes the drug and the patient rather than the moment
Doubling the concentration doubles the elimination rate in mg/hour, but the same volume of plasma is still cleared each hour
When elimination saturates (zero-order kinetics, e.g. phenytoin, ethanol) the elimination rate stops rising with concentration, so clearance falls as concentration rises and is no longer a constant
The “volume cleared per unit time” description is just the interpretation of the units (mg/hour ÷ mg/L = L/hour), i.e. the volume of plasma that would need to be completely emptied of drug each hour to account for the elimination rate
Describe what clearance is?
The volume of plasma completely cleared of drug per unit time (L/hr or mL/min), i.e. elimination rate divided by plasma concentration. In first-order kinetics it is constant, as elimination rate is proportional to concentration.
The extraction ratio refers to ratio of elimination of the drug through the organ of interest and is given by:
Extraction Ratio (EH)=CinCin−Cout=1−Concentration InConcentration Out
Unlike clearance, the extraction ratio belongs to a single organ and has no units, it is the fraction of drug delivered to the organ that does not come back out in the venous blood
E=0 means the organ removes nothing, E=1 means the organ removes everything delivered to it
It is converted into a clearance by multiplying by organ blood flow (see Organ Clearance)
What is the mathematical definition of extraction ratio?
The fraction of drug entering an organ that is removed in a single pass:
E=CinCin−Cout=1−CinCout
Elimination Rate Constant
The elimination rate constant (k) is the fraction of the drug in the body removed per unit time, i.e. the elimination rate divided by the amount of drug in the body (Abody):
k=AbodyElimination Rate(hour−1)
Since Abody=VD⋅C (the definition of volume of distribution), clearance and k are linked directly:
Elimination Rate∴CL=CL⋅C=k⋅Abody=k⋅VD⋅C=k⋅VD
Derive the relationship between clearance, elimination rate constant and volume of distribution
Elimination rate =CL⋅C=k⋅Abody, and Abody=VD⋅C, so CL=k⋅VD (and therefore t1/2=0.693⋅VD/CL)
Half Life
Half Life and the Elimination Rate Constant
Fall in plasma concentration after a single IV dose (one-compartment, first-order) is given by:
C(t)=C0⋅e−kt
Differentiating shows the rate of fall is proportional to the concentration at that time, with k as the proportionality constant:
dtdC(t)=−k⋅C0⋅e−kt=−k⋅C(t)
Solving for when C(t)=0.5⋅C0 (i.e. when the plasma concentration falls by half):
The half life is the same whatever the starting concentration, which is only true in first-order kinetics (in zero-order kinetics a fixed amount is removed per unit time, so the time to halve gets longer at higher concentrations)
Derive the relationship between half life and the elimination rate constant
C(t)=C0e−kt. Setting C(t)=0.5⋅C0 gives 21=e−kt1/2, so kt1/2=ln2 and t1/2=kln2≈k0.693
So half life is a dependent variable, set by clearance and volume of distribution rather than the other way round
A drug can have a long half life either because it is cleared slowly or because most of it sits outside the plasma where the clearing organs can’t get to it
Volume of distribution depends on the drug’s lipid solubility and its binding to plasma proteins and tissues, not on the dose (see Volume of Distribution)
e.g. in critical illness, a rise in VD (fluid overload, hypoalbuminaemia) can prolong half life even when clearance is unchanged
What Half Life Determines
Duration of action after a single dose
Time to reach steady state with repeated dosing or a constant infusion, which takes about 4–5 half lives (94–97% of the final concentration), independent of the dose rate
Time for a drug to be eliminated after it is stopped, which also takes about 4–5 half lives
Dosing interval needed to avoid large fluctuations in plasma concentration between doses
What does half life determine clinically?
Duration of action after a single dose, time to reach steady state (about 4–5 half lives), time to eliminate the drug once stopped, and the dosing interval needed to limit peak–trough fluctuation
Clearance at Steady State
The amount of drug in the body changes by whatever goes in minus whatever is eliminated:
dtdAbody=Dose Rate−CL⋅C
At steady state the amount in the body is no longer changing, so dAbody/dt=0 and the dose rate in equals the elimination rate out:
Maintenance Dose Rate (DR)∴CSS=Elimination Rate=Clearance (CL)×Steady State Drug Concentration (CSS)∝CL1(where DR is constant)
Measuring Clearance
Every method below is the definition CL=Elimination Rate/C applied to a situation where the elimination rate can be worked out
Steady State Infusion
Whole body clearance be determined using the steady state formula:
CL=CSSDR
How is clearance mathematically defined at steady state?
Clearance (CL)=Steady State Drug Concentration (CSS)Maintenance Dose Rate (DR)
Renal Clearance
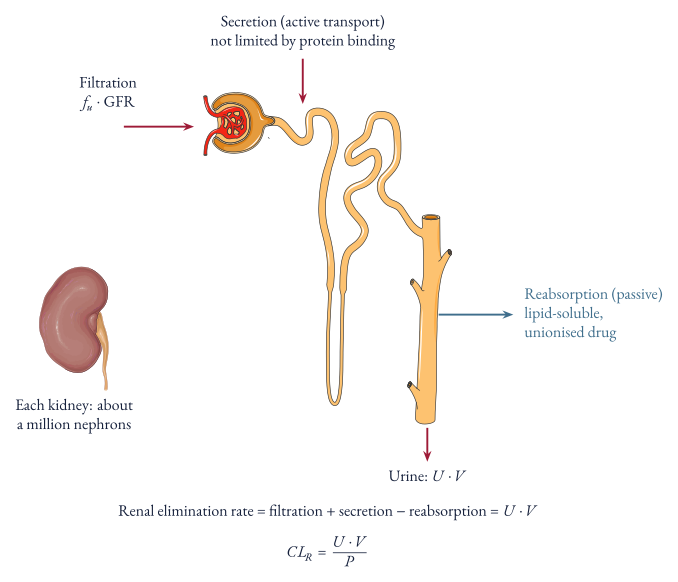
Renal clearance can be derived from the definition of clearance based on elimination rate, where the elimination rate is the amount of drug appearing in urine per unit time:
Clearance (CL)=Drug ConcentrationElimination Rate=Plasma ConcentrationUrine Concentration (U)×Urine Flow (V)Figure 7 Renal handling of a drug along the nephron. Kidney and nephron adapted from Servier Medical Art, CC BY 4.0
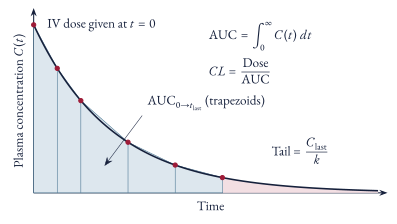
Single IV Bolus and AUC
Figure 8 Clearance from a single IV bolus
An IV bolus can be used to determine clearance where after given enough time, all of it is eliminated therefore:
DoseCL=CL⋅AUC=AUCDose
How is clearance calculated from a single IV dose?
CL=AUC0→∞Dose, because total amount eliminated =∫0∞CL⋅C(t)dt=CL⋅AUC, and after an IV dose that equals the dose.
Mathematical Derivation
Let A(t) be the amount of drug eliminated by time t, its rate of change is the elimination rate:
dtdA(t)=CL⋅C(t)
To get the total amount ever eliminated, integrate from 0 to infinity:
Atotal=∫0∞CL⋅C(t)⋅dt=CL⋅∫0∞C(t)⋅dt=CL⋅AUC
After an IV dose all of the drug is eventually eliminated, so Atotal=Dose
This doesn’t assume any compartment model, only that CL is constant so it can come out of the integral, hence it is the “model-independent” way of measuring clearance
For an oral dose only the bioavailable fraction ever reaches the plasma, so F⋅Dose=CL⋅AUC
For a one-compartment IV bolus, C(t)=C0e−kt where C0=Dose/VD and k is the elimination rate constant, which gives the same CL=k⋅VD result as Elimination Rate Constant:
Whole body clearance is the sum of the clearances of each eliminating organ, since each organ’s elimination rate adds to the total and they all divide by the same plasma concentration:
CLtotal=CLhepatic+CLrenal+CLother
Each organ’s share of total clearance is therefore its share of the elimination rate, so the fraction of the dose excreted unchanged in the urine and the fraction metabolised are:
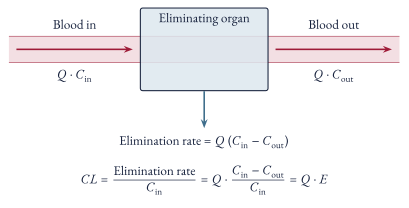
For blood (Q) flowing through an organ, the organ’s elimination rate is the drug delivered minus the drug leaving (Fick principle), and blood flow in equals blood flow out as blood isn’t stored in the organ:
Elimination Rate=Q⋅Cin−Q⋅Cout=Q(Cin−Cout)
Dividing by the concentration delivered to the organ (the definition of clearance) gives:
CLorgan=CinQ(Cin−Cout)=Q⋅EFigure 9 Organ clearance from the Fick principle
Clearance of an organ is dependent on the blood flow to that organ
So the maximum possible clearance of an organ is its blood flow (E=1), which for the liver is roughly 1.5 L/min (about 90 L/hour)
Strictly Q⋅E is a blood clearance (CLb), since it uses blood flow and blood concentrations. The elimination rate is the same whichever concentration it is divided by, so using the blood:plasma ratio (λ, see Pharmacology Basics):
CL⋅C=CLb⋅Cb=CLb⋅λ⋅C∴CL=λ⋅CLb
Hence plasma clearance can appear to exceed hepatic blood flow for drugs that concentrate in red cells (λ>1)
Derive organ clearance in terms of blood flow and extraction ratio
Elimination rate =Q(Cin−Cout) (Fick principle), so CL=CinQ(Cin−Cout)=Q⋅E
Hepatic Extraction Ratio (Well-Stirred Model)
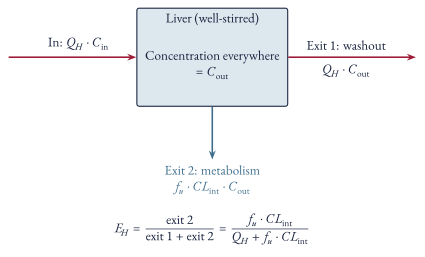
The well-stirred model treats the liver as a single well-mixed compartment, so the concentration the hepatocytes see is the same as the concentration leaving in the hepatic vein (Cout)
At steady state, drug entering the liver must leave by one of two routes:
Washed out in hepatic venous blood at a rate of QH⋅Cout
Metabolised by hepatocytes, which only see unbound drug (fu⋅Cout) and clear it at their intrinsic clearance (CLint, the clearance of the liver if blood flow were not limiting), at a rate of fu⋅CLint⋅Cout
Substituting into the definition of extraction ratio:
EH∴CLH=1−CinCout=1−QH+fu⋅CLintQH=QH+fu⋅CLintfu⋅CLint=QH⋅EH=QH+fu⋅CLintQH⋅fu⋅CLintFigure 10 Well-stirred model of the liver. Liver adapted from Servier Medical Art, CC BY 4.0
The denominator is not hepatic blood flow, it is the sum of the two exits from the liver
Each exit is a rate divided by Cout, so both have units of L/hour and can be added: QH is the volume of liver blood emptied of drug per hour by being carried away, fu⋅CLint is the volume emptied per hour by metabolism
EH is therefore the share of drug that takes the metabolism exit rather than the washout exit
e.g. with QH=90 L/hour, fu⋅CLint=10 L/hour and Cout=1 mg/L, 90 mg/hour leaves in hepatic venous blood and 10 mg/hour is metabolised, so 100 mg/hour must be entering (Cin≈1.11 mg/L) and EH=10/100=0.1
Assumptions of the model:
The liver is well-stirred (other models such as the parallel-tube model give a different formula)
Only unbound drug is metabolised
Kinetics are linear, so CLint is constant (roughly Vmax/Km at concentrations well below Km, where Vmax is the maximal velocity of the reaction at saturating substrate concentration and Km is Michaelis constant which expresses how tightly the enzyme binds the drug substrate)
What is the hepatic extraction ratio in the well-stirred model, and what does its denominator represent?
EH=QH+fu⋅CLintfu⋅CLint
The denominator is the two competing routes for drug to leave the liver: washout in hepatic venous blood (QH) and metabolism of unbound drug (fu⋅CLint)
Flow-Limited vs Capacity-Limited Clearance
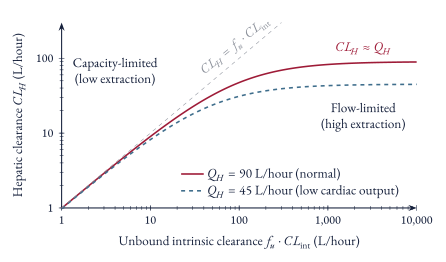
The two extremes of the well-stirred model (Figure 10) are where it becomes clinically useful:
Figure 11 Hepatic clearance against unbound intrinsic clearance
e.g. lignocaine can accumulate in low cardiac output states as its clearance follows hepatic blood flow, whereas enzyme induction (e.g. rifampicin) speeds up the clearance of warfarin but makes little difference to high extraction drugs
Cloze
High extraction drugs have flow-limited hepatic clearance, whereas low extraction drugs have capacity-limited hepatic clearance
References
1.
Birkett DJ. Pharmacokinetics made easy. 2.ed., rev. ed. Sydney London: McGraw-Hill; 2005. 131 p.
At steady state the dose rate going in equals the elimination rate coming out (see Clearance at Steady State), so for intravenous dosing:
Maintenance Dose Rate (DR)=CL×Steady State Concentration (CSS)
The unbound steady state concentration is CuSS=fu⋅CSS, and it’s the unbound concentration which drives the effect
The rest of this note is for a drug cleared by the liver, where only unbound drug is metabolised, so clearance follows the well-stirred model (see Hepatic Extraction Ratio (Well-Stirred Model)):
CL=QH+fu⋅CLintQH⋅fu⋅CLint
Determinants of Steady State Concentration
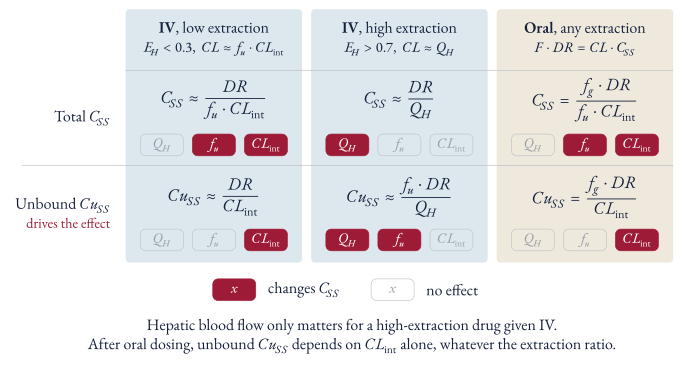
Figure 12 Determinants of total and unbound steady state concentration for a hepatically cleared drug
For drugs given orally, the unbound concentration depends only on intrinsic clearance (and the fraction absorbed), and the total concentration depends on intrinsic clearance and fraction unbound, whatever the hepatic extraction ratio
For drugs given intravenously, it depends on the hepatic extraction ratio:
Low hepatic extraction ratio: the unbound concentration depends on intrinsic clearance, and the total concentration depends on intrinsic clearance and fraction unbound
High hepatic extraction ratio: the unbound concentration depends on hepatic blood flow and fraction unbound, and the total concentration depends on hepatic blood flow
Hence hepatic blood flow only matters for a high extraction ratio drug given intravenously
Intravenous Dosing
For low hepatic extraction ratio drugs CL≈fu⋅CLint, so:
CSSCuSS≈fu⋅CLintDR=fu×CSS≈CLintDR
For high hepatic extraction ratio drugs CL≈QH, so:
CSSCuSS≈QHDR≈QHfu⋅DR
What determines the total and unbound steady state concentration of a low hepatic extraction ratio drug given IV?
CL≈fu⋅CLint, so CSS≈fu⋅CLintDR (intrinsic clearance and fraction unbound) and CuSS≈CLintDR (intrinsic clearance only)
What determines the total and unbound steady state concentration of a high hepatic extraction ratio drug given IV?
CL≈QH, so CSS≈QHDR (hepatic blood flow only) and CuSS≈QHfu⋅DR (hepatic blood flow and fraction unbound)
Oral Dosing
Only the bioavailable fraction of each dose reaches the systemic circulation (see Bioavailability), so:
F×DR∴CSS=CL×CSS=CLF×DR=CLfg⋅fH⋅DR
Substituting the well-stirred model for both CL and fH=1−EH=QH+fu⋅CLintQH:
Hepatic blood flow drops out because it changes bioavailability and clearance by the same proportion, so a fall in blood flow lowers clearance but lets proportionally less drug through the liver on its first pass, and the two cancel
This holds whatever the extraction ratio, as the approximations for low and high extraction drugs were never needed
Derive the unbound steady state concentration of a hepatically cleared drug given orally
F⋅DR=CL⋅CSS with F=fg⋅fH. Substituting fH=QH+fu⋅CLintQH and CL=QH+fu⋅CLintQH⋅fu⋅CLint, the QH+fu⋅CLint and QH terms cancel:
CSS=fu⋅CLintfg⋅DR,CuSS=CLintfg⋅DR
Cloze
After oral dosing of a hepatically cleared drug, the unbound steady state concentration depends only on intrinsic clearance, whatever the hepatic extraction ratio
Why doesn't hepatic blood flow affect the steady state concentration of a high extraction drug given orally?
A fall in hepatic blood flow lowers clearance (CL≈QH) but also lowers the fraction escaping first-pass (fH≈fu⋅CLintQH) by the same proportion, so F/CL, and hence CSS=F⋅DR/CL, is unchanged
Enzyme induction or inhibition (changing CLint) changes the unbound steady state concentration in every case except a high extraction ratio drug given intravenously
Displacement from plasma proteins (raising fu) lowers the total concentration but leaves the unbound concentration unchanged for low extraction ratio drugs and for oral dosing, so it’s mostly of no clinical consequence; the exception is a high extraction ratio drug given intravenously, where the unbound concentration rises
A fall in hepatic blood flow (e.g. low cardiac output) only raises the steady state concentration of a high extraction ratio drug given intravenously, e.g. a lignocaine infusion
When does displacement of a drug from plasma proteins raise its unbound steady state concentration?
Only for a high hepatic extraction ratio drug given IV (CuSS≈fu⋅DR/QH). For low extraction drugs and oral dosing, clearance rises with fu, so the total concentration falls and the unbound concentration is unchanged
Which steady state concentrations change with a fall in hepatic blood flow?
Only those of a high hepatic extraction ratio drug given IV, as CSS≈DR/QH (e.g. lignocaine in low cardiac output states). Low extraction drugs and oral dosing are unaffected
References
1.
Birkett DJ. Pharmacokinetics made easy. 2.ed., rev. ed. Sydney London: McGraw-Hill; 2005. 131 p.
Drug effect follows the concentration at the site of action (the effect site), not the plasma concentration
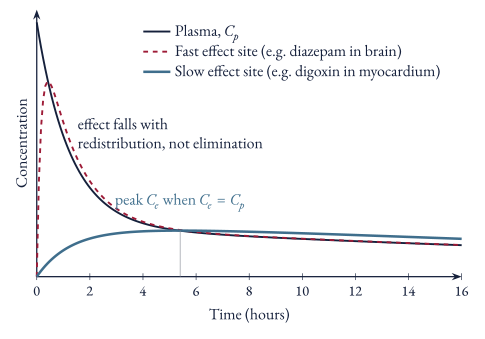
Whether the two match depends on how quickly the effect site equilibrates with plasma
The effect site is modelled as an extra compartment of negligible volume linked to the central compartment (see Two-Compartment Model), which equilibrates at a rate set by ke0:
dtdCe=ke0(Cp−Ce)
- When $k_{e0}$ is large, $C_{e}$ follows $C_{p}$ almost immediately, so effect follows plasma concentration
- When $k_{e0}$ is small, $C_{e}$ lags behind $C_{p}$, rising while $C_{p}>C_{e}$ and peaking when $C_{e}=C_{p}$ (where $dC_{e}/dt=0$)
- The equilibration half-time ($t_{1/2}k_{e0}=0.693/k_{e0}$) describes how quickly the effect catches up with a change in plasma concentration
Figure 13 Plasma and effect-site concentrations after an IV bolus
What equation links plasma and effect-site concentration, and when does effect-site concentration peak?
dtdCe=ke0(Cp−Ce). After a bolus, Ce rises while Cp>Ce and peaks when Ce=Cp.
Rapidly Equilibrating Effect Site
e.g. diazepam used intravenously in status epilepticus:
The brain is highly perfused, so brain concentrations and the anticonvulsant effect follow plasma concentrations
Plasma concentrations fall rapidly during the distribution phase as diazepam redistributes to other tissues, so the effect falls with them and fitting can recur within 2–4 hours if more drug is not given, even though the elimination half-life is very long
The duration of action of a single dose is therefore set by redistribution rather than elimination
If the site of a toxic effect is rapidly accessible, the peak concentration at the end of a bolus (before distribution, ≈Dose/V1) can cause toxicity
The injection is given slowly so distribution happens while the drug is being given, e.g. intravenous theophylline and lignocaine
Cloze
After a single IV dose of diazepam, the anticonvulsant effect wears off due to redistribution, not elimination, so fitting can recur within 2–4 hours
Slowly Equilibrating Effect Site
e.g. digoxin given intravenously:
Digoxin distributes slowly to its site of action (the inotropic effect) in cardiac muscle, so the effect increases while plasma concentrations are decreasing, both being driven by the same movement of drug from plasma into tissue
It takes about 6 hours to reach full effect even when given intravenously, so IV dosing gives no advantage in time to full effect, and loading is best done with divided oral doses at least 6 hours apart so the full effect of each dose can be assessed before more is given
In the first 6–8 hours after a dose, plasma concentrations bear no relationship to effect, so levels must be taken at least 6 hours after a dose, preferably as a trough just before the next dose
Why must digoxin levels be taken at least 6 hours after a dose?
Digoxin equilibrates slowly with its site of action in cardiac muscle, so for the first 6–8 hours plasma concentrations are high while the effect is still rising and bear no relationship to effect. Ideally take a trough level just before the next dose.
References
1.
Birkett DJ. Pharmacokinetics made easy. 2.ed., rev. ed. Sydney London: McGraw-Hill; 2005. 131 p.