Assessing a Rhythm Strip in an Unstable/Critical Patient
- Is there any electrical activity?
- What is the ventricular QRS rate?
- Is the QRS rhythm regular or irregular?
- Is the QRS complex width normal (‘narrow’) or broad?
- Is atrial activity present?
- Is atrial activity related to ventricular activity and, if so, how?
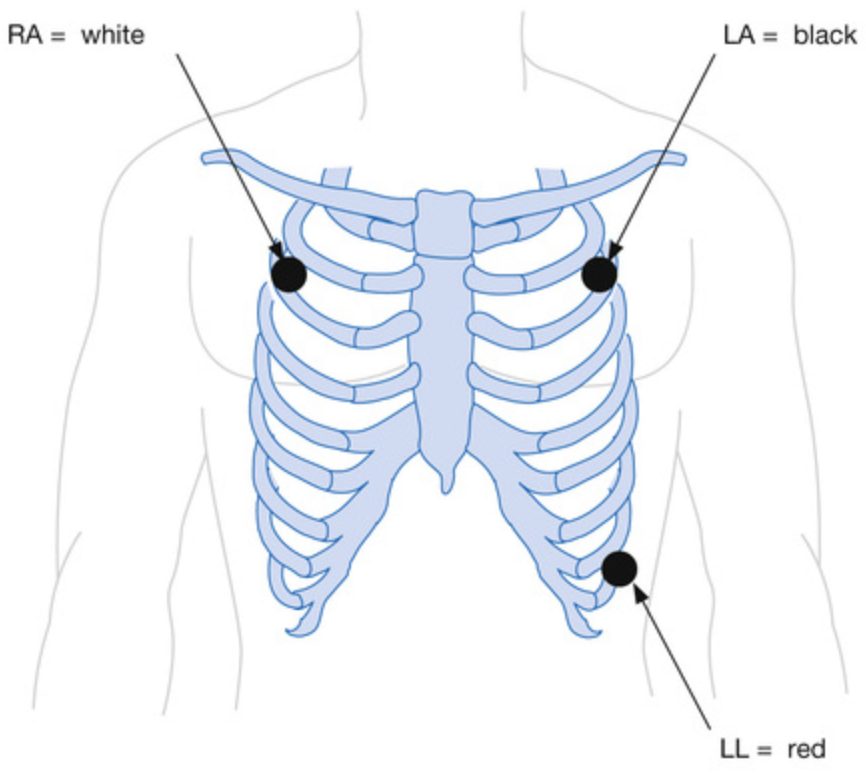
Procedure
- 3-electrode system (gives leads I, II and III)
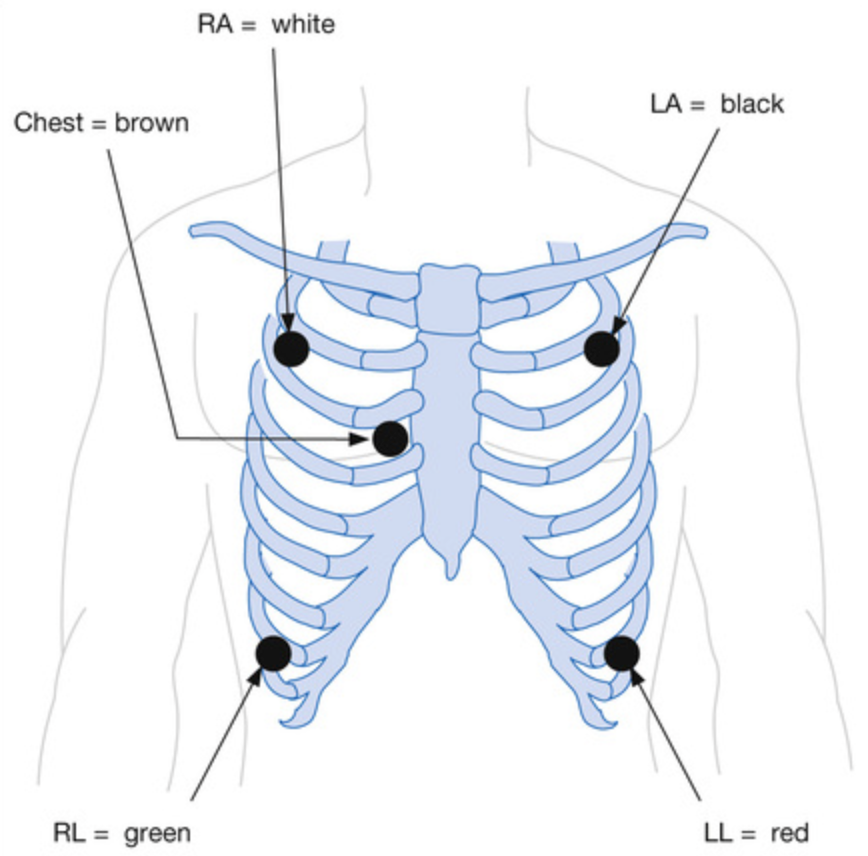
- 5-electrode system (gives leads I, II and III and a single unipolar lead depending on the position of the brown lead V1-6)
Basics
Rate, Rhythm, Axis
- Rate
- Multiply the number of QRS complexes in the 10 second strip by 6 or do 300 divded by the R-R interval in number of large squares
- 1 square = 300
- 2 square = 150
- 3 square = 100
- 4 square = 75
- 5 square = 60
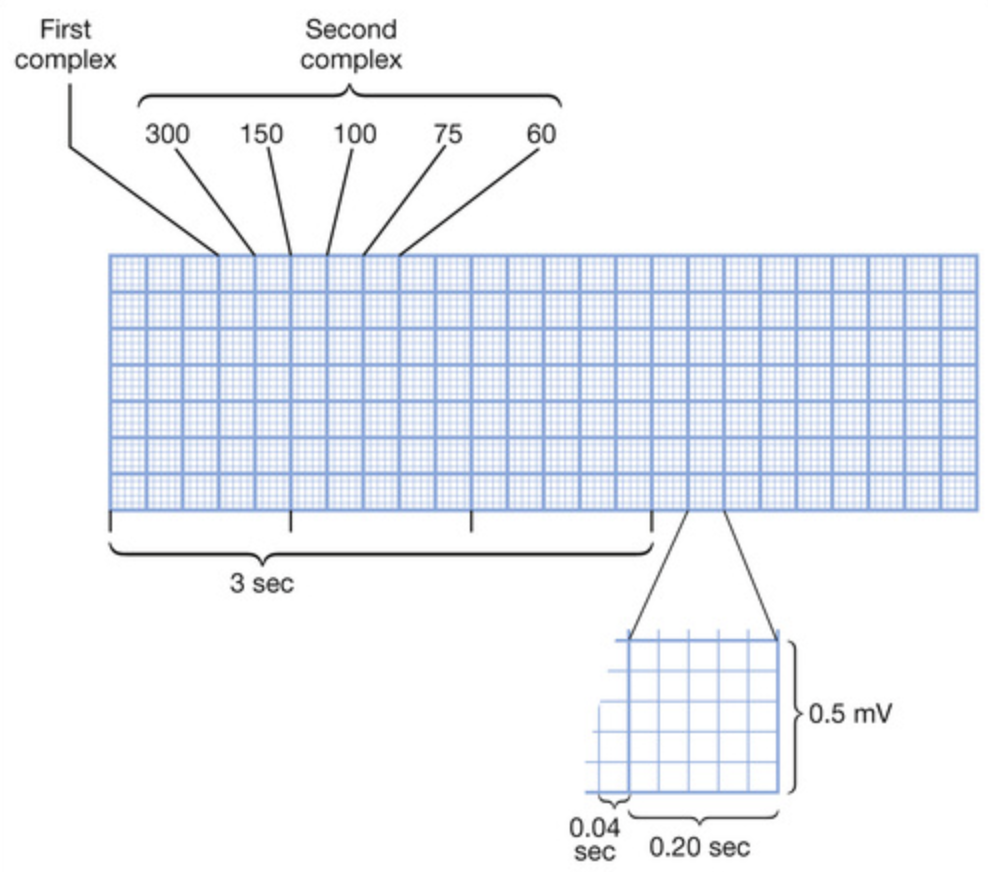
- Multiply the number of QRS complexes in the 10 second strip by 6 or do 300 divded by the R-R interval in number of large squares
- Rhythm
- If in doubt, use a piece of paper to mark out at least 3 consecutive R waves and check the rate is the same further along the rhythm strip
- Regular rhythm with abnormal P wave preceding each QRS complex ⇒ atrial rhythm
- Irregular rhythm with P waves ⇒ multifocal atrial rhythm
- Regular narrow-complex rhythm with no (or retrograde) P waves ⇒ SVT
- Regular rhythm with visible flutter waves ⇒ atrial flutter
- Irregular rhythm with no P waves ⇒ atrial fibrillation or atrial flutter with variable AV conduction block
- Axis
- Always compare to the TP line
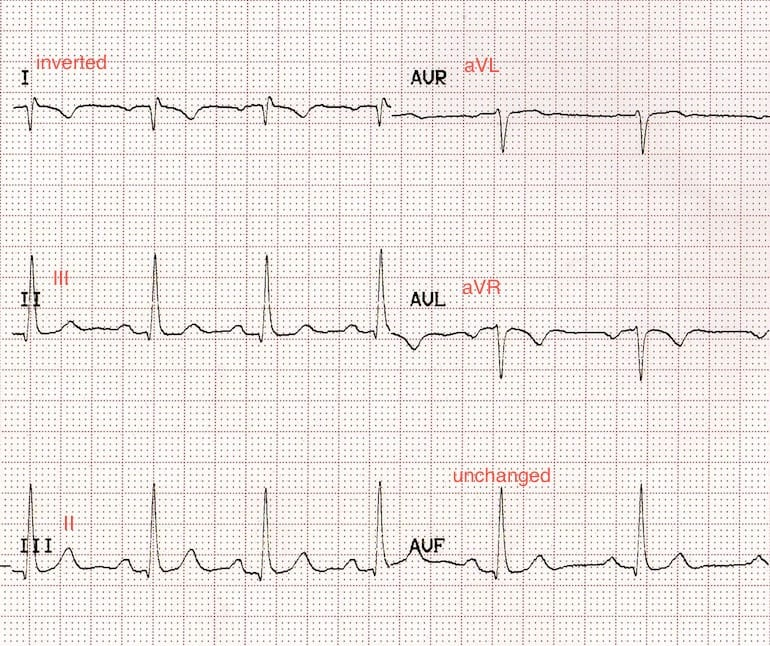
- LA/RA reversal is defined by features:
- Lead I becomes inverted
- Leads II and III switch places
- Leads aVL and aVR switch places
- Lead aVF remains unchanged
- In comparison to dextrocardia, it has normal R-wave progression
P Wave
- P wave configurations in lead II:
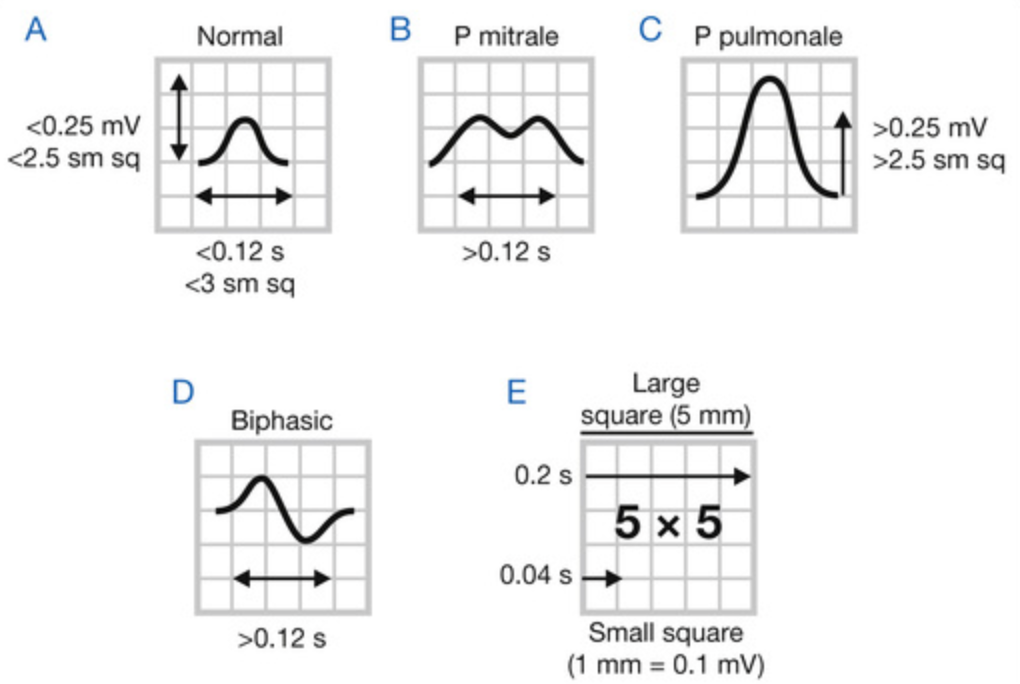
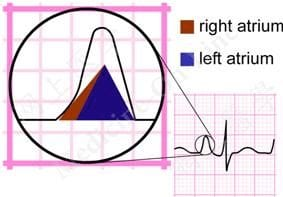
- P mitrale ⇒ left atrial enlargement
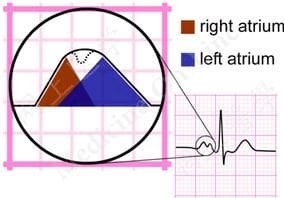
- P pulmonale ⇒ right atrial enlargement
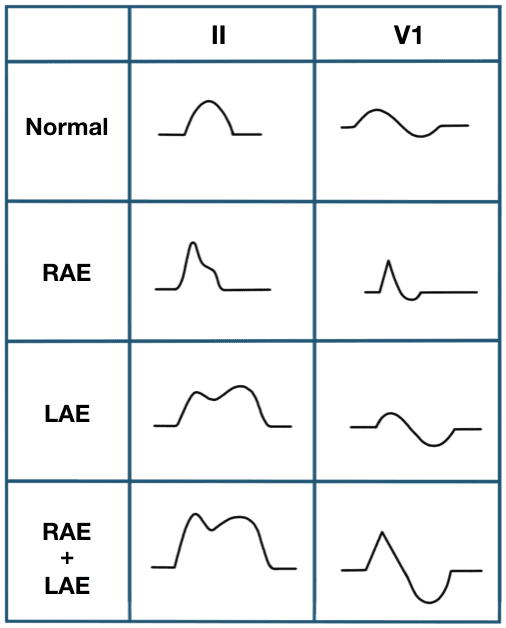
- P mitrale ⇒ left atrial enlargement
PR Interval
- Start of P wave to the start of the QRS complex
- Normal duration is 120-200 msec (3-5 small squares)
- First-degree AV block if >200 msec
- Accessory AV pathway/pre-excitation if <120 msec
Q Waves
- Pathological if any of:
- More than 33% of total QRS complex
- More than 2mm deep
- More than 40 msec (one small square) width
- Present in leads V1-3
- Small Q waves can be normal in leads III and V1 as well as I, aVL and V5-6
QRS Complex
- Duration
- Normal duration <120 msec
- Widened QRS suggests some abnormal ventricular conduction (e.g. bundle branch block, ventricular origin, accessory pathway etc.)
- A wide QRS complex causes secondary ST segment and T wave changes making it sometimes difficult to interpret
- Height
- Low voltage overall may be caused by body habitus, lung hyperinflation (e.g. COPD), hypothermia, hypothyroidism, pericardial effusion, chronic cardiac ischaemia
R Wave Progression
- QRS complexes are predominantly negative in V1 and become more positive across to V6, being equipotent at V3 or V4
ST Segments
- Always assess for:
- Elevation
- Depression
- Shape (concave up, concave down, horizontal etc)
- Concave up shape is less concerning for ischaemia
T Waves
- Assess for:
- Orientation
- Height
- Normal to have inverted T waves in aVR and V1 and occasionally in V2 and inferior leads
QT Interval
- Measured from the start of the QTS complex until the end of the T wave
- Prolonged if:
- QTc >440 msec in men (440-450 msec considered borderline)
- QTC >460 msec in women (440-460 msec considerred borderline)
- A QTc >500 msec is associated with an increased risk of Torsades de Pointes VT
Rule of thumb for QT Intervals
The QT interval should be less than half of the proceeding R-R interval
Other Waves
- Delta wave (slurred initial upslope on QRS complex) ⇒ ventricular pre-excitation in WPW syndrome
- J (Osborne wave) notch at junction of QRS and ST segment ⇒ hypothermia, hypercalcaemia, vasospastic angina, SAH
- U wave (occurs after T wave) ⇒ hypokalaemia, bradycardia
Myocardial Ischaemia and Infarction
What to do if you are unsure about ischaemic changes in an ECG (provided the patient is stable)
- Repeat the ECG in 20 minutes
- Call for help
- ECG changes in ischaemia in order:
- Hyperacute T waves
- ST-segment elevation/depression
- Q waves (although not always)
- T wave inversion
- Posterior STEMI features on a standard ECG:
- Reciprocal changes in anterior leads (V1-3) such as:
- ST elevation in V1-3
- Tall, braod (30msec) R waves (uspide down Q waves)
- Upright T waves
- Dominant R waves in V2
- Only 0.5mm of ST elevation in V7, 8 or 9 is required for a diagnosis of posterior STEMI
- Reciprocal changes in anterior leads (V1-3) such as:
Posterior OMI
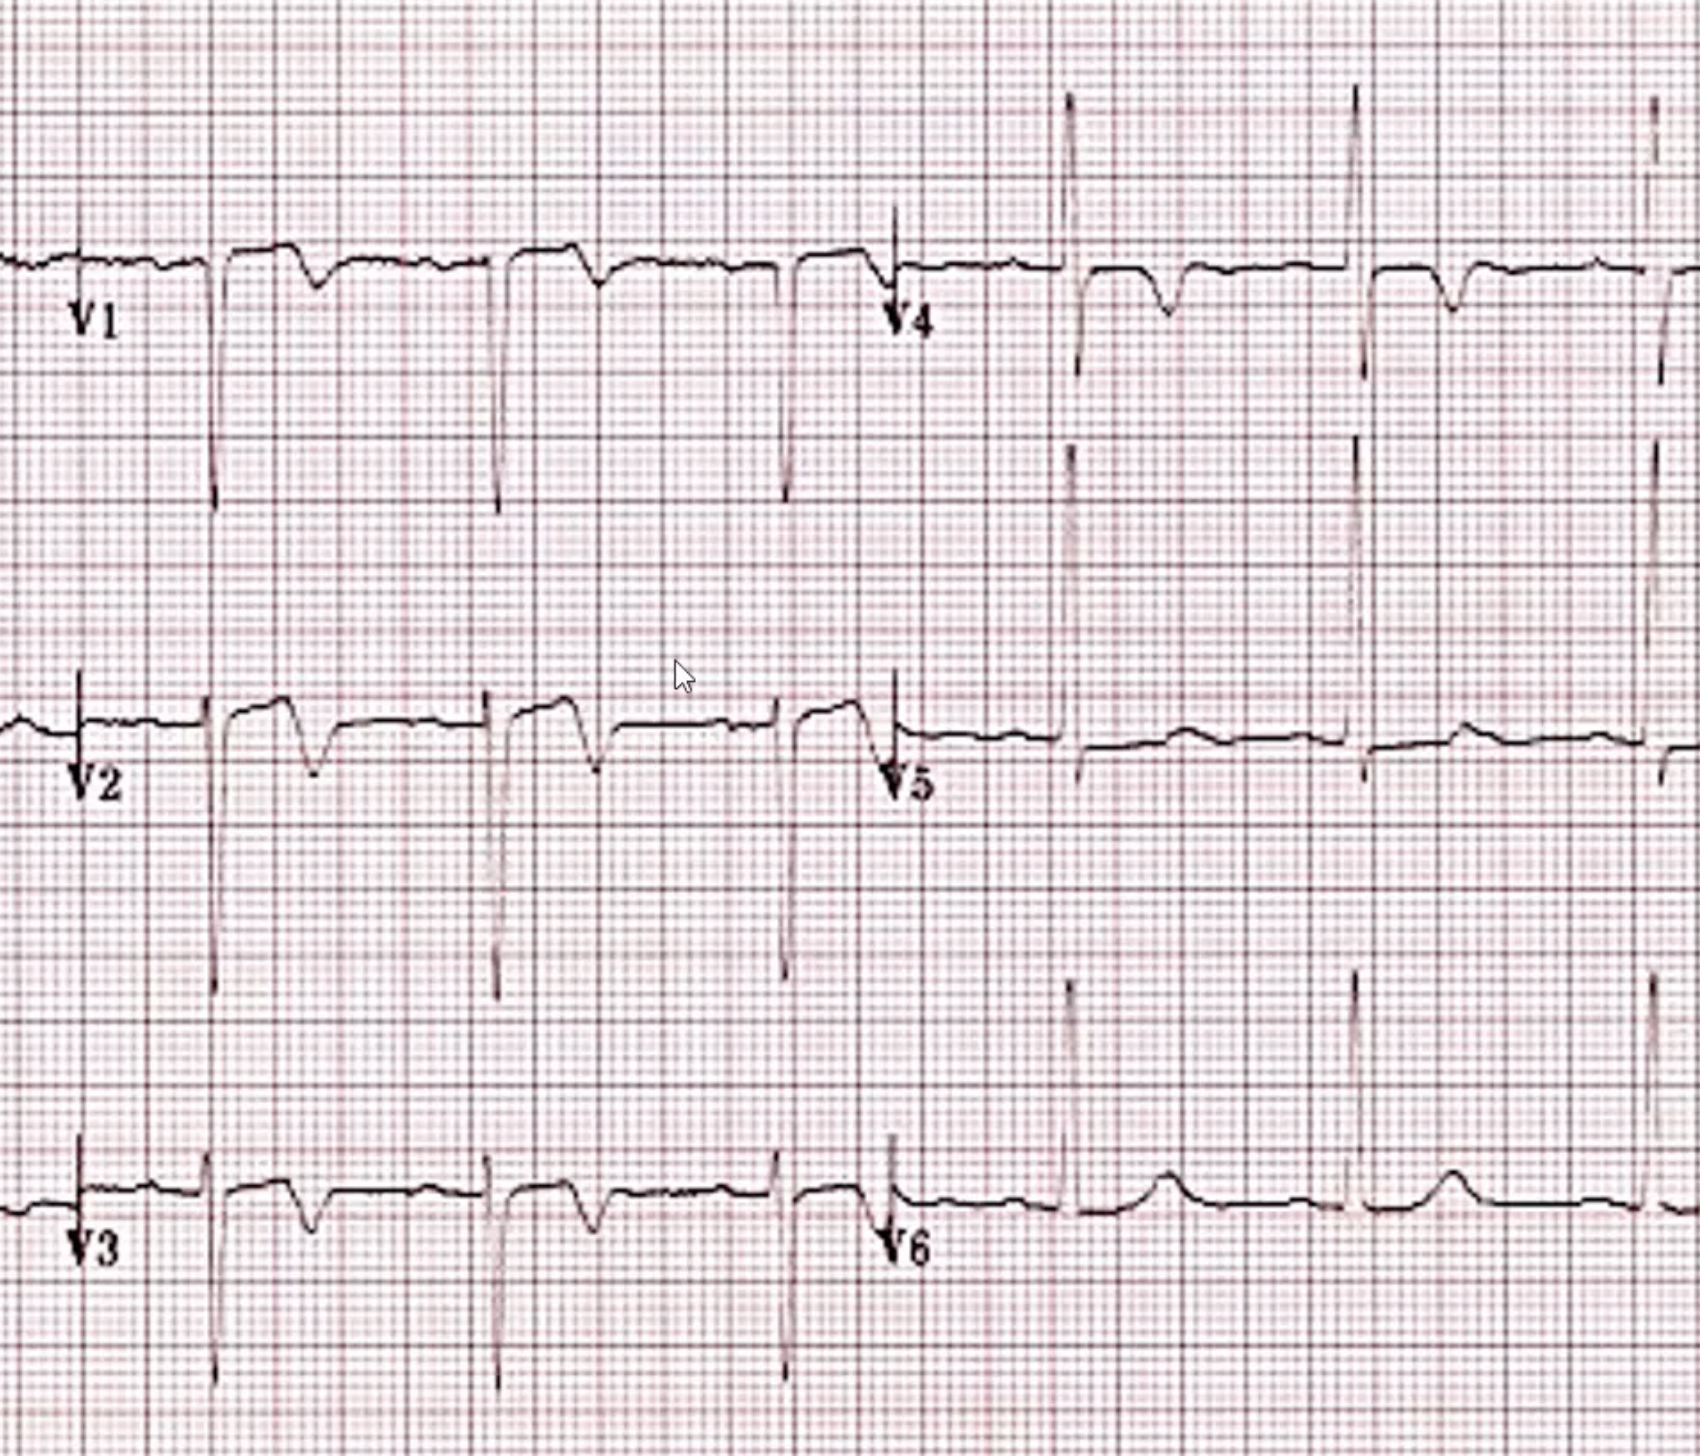
- ST depression maximal in leads V1-4 without progression to V5-6 is highly concerning for a posterior OMI and can be considered to be posterior MI even in the absence of ST elevation in V7-9
- This is because of poor conduction through the aerated lung
- Inferior MI involving the right ventricle ECG features:
- ST elevation in lead III > lead II
- ST elevation in V1 > V2
- ST elevation in V1
- Consider RV infarct in all cases of inferior MI
- Proceed with a right sided ECG or use V4RT
- Be careful of GTN as it can cause hypotension
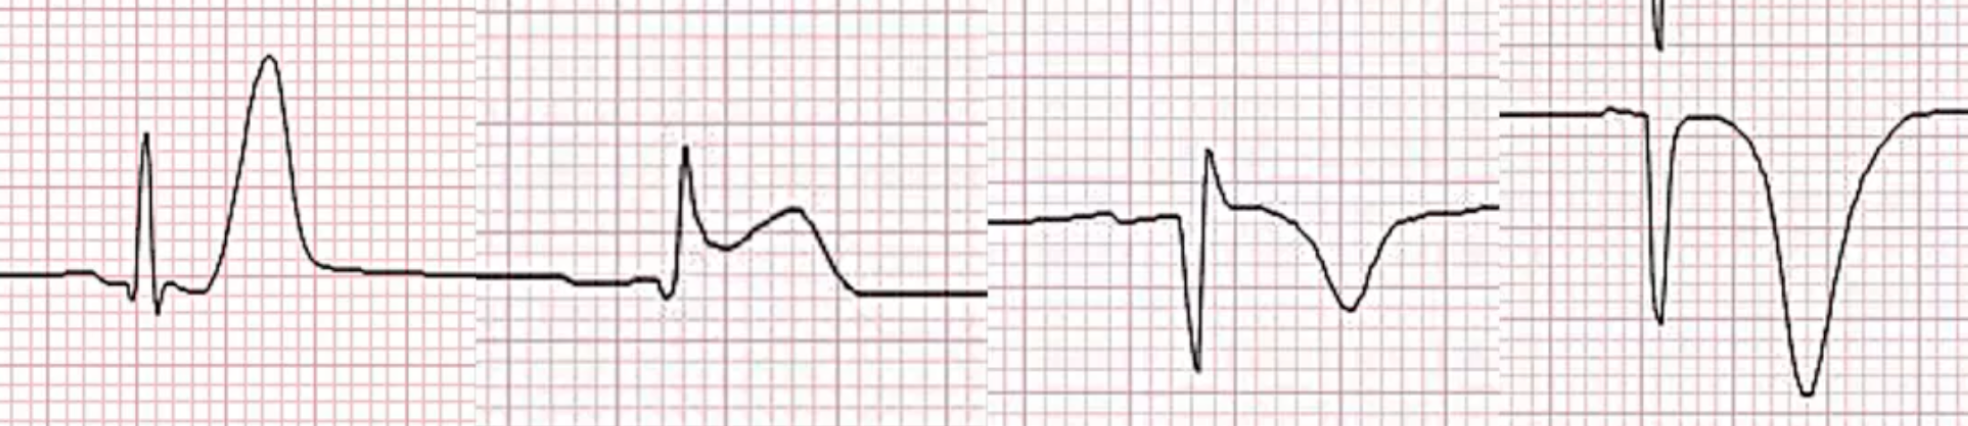
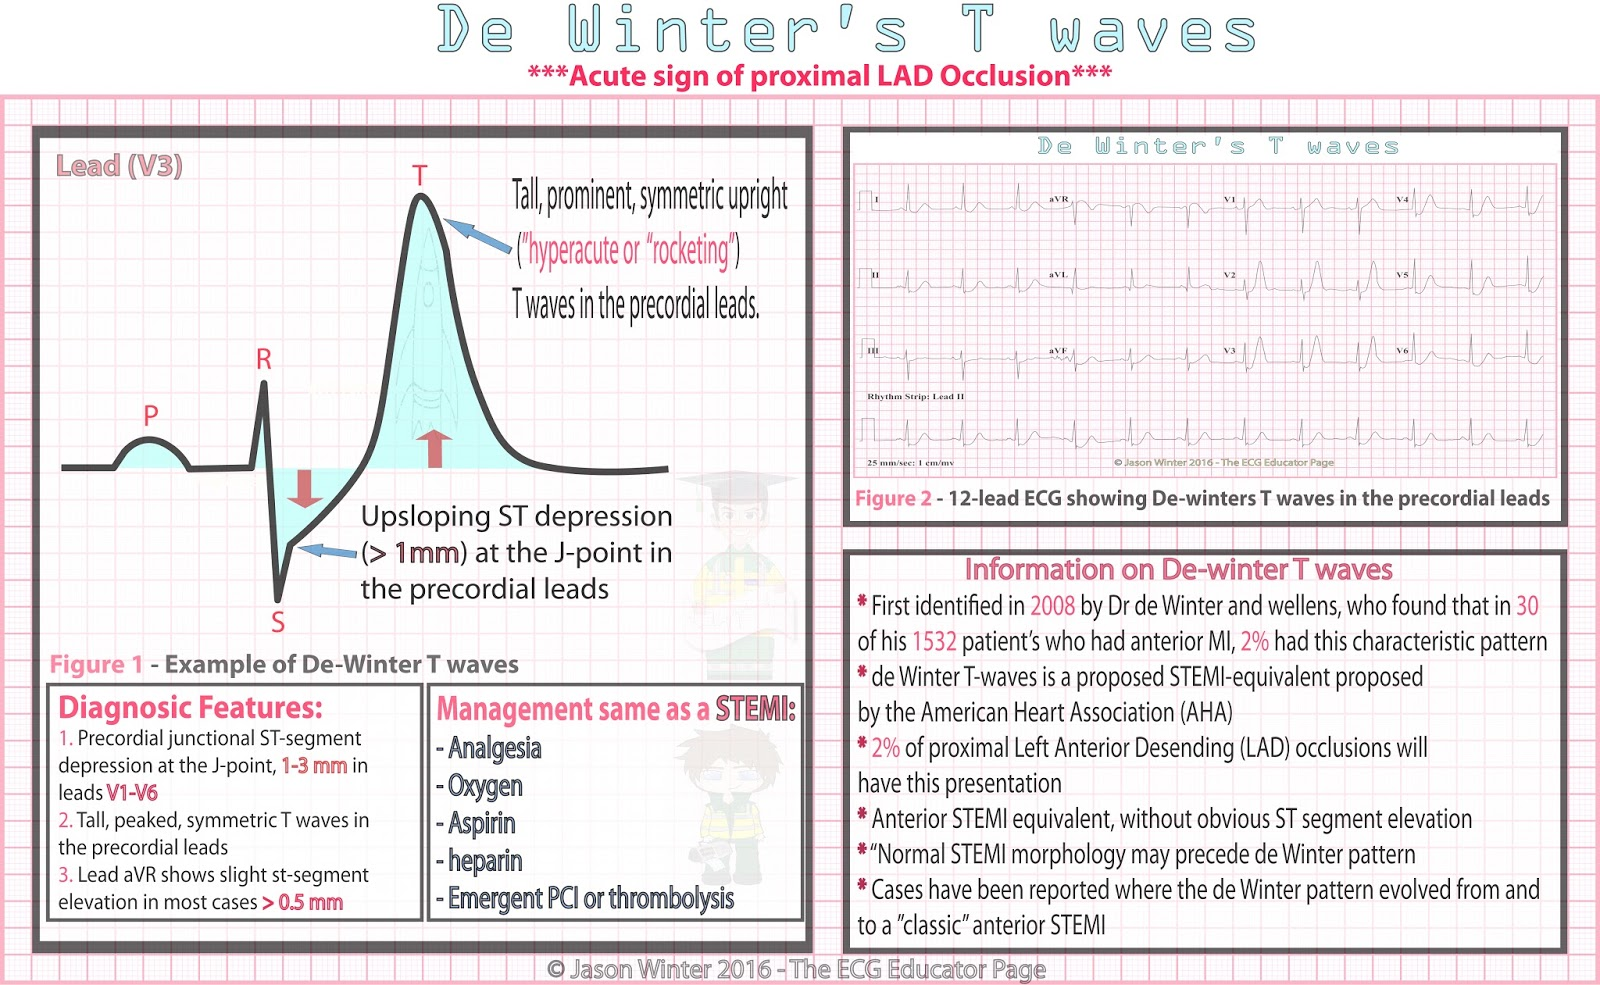
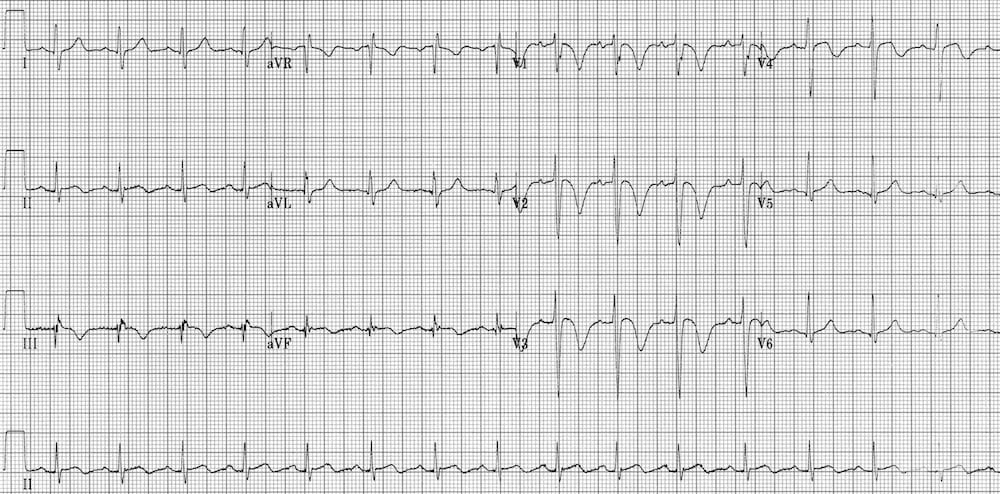
- De Winter T waves
- ECG features
- Tall, prominent, symmetrical T waves in precordial leads
- Upsloping ST segment depression >1mm at the J point in the precordial leads (no ST elevation int he precordial leads)
- Reciprocal ST segmeent elevation in aVR
- Typical STEMI morphology may precede or follow the De Winter pattern
- Treat as a STEMi equivalent
- ECG features
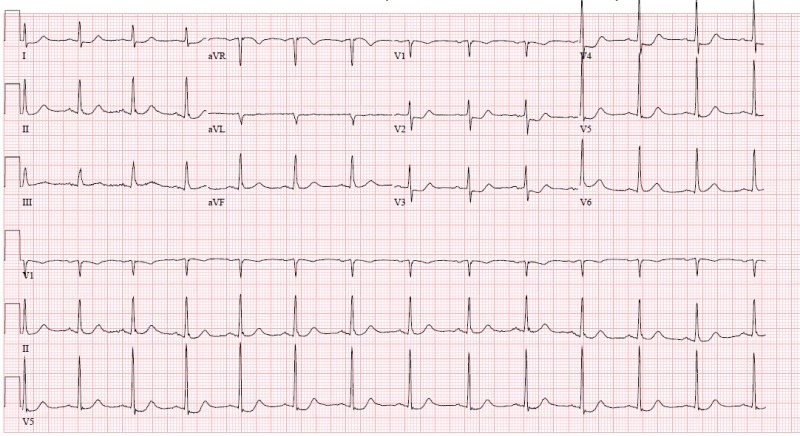
- Wellen’s snydrome
- ECG features: deeply inverted or biphasic T waves in V2-3
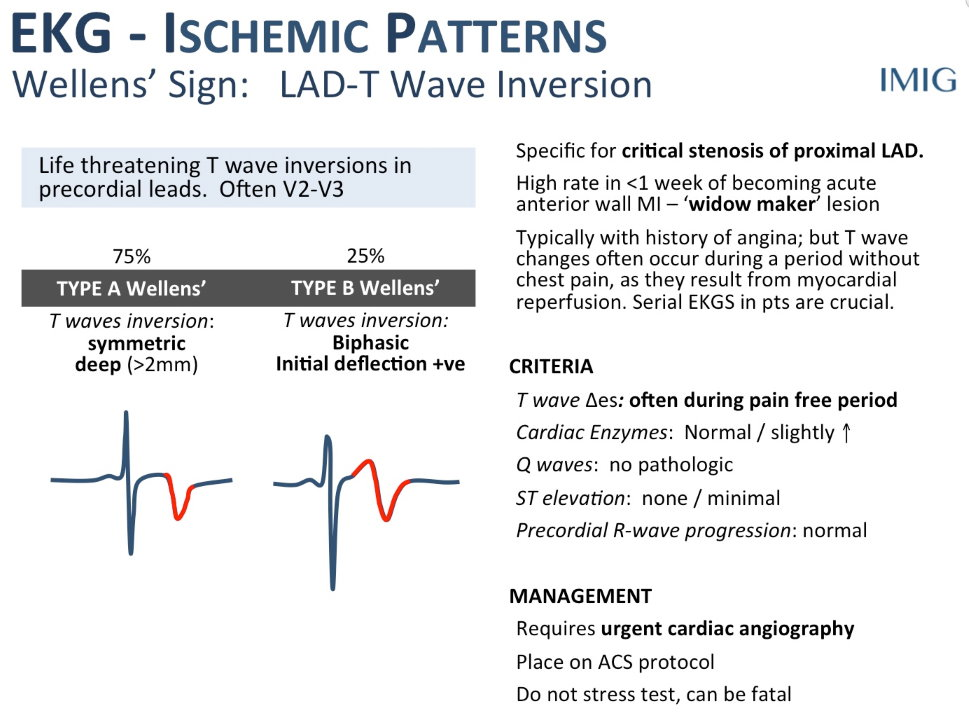
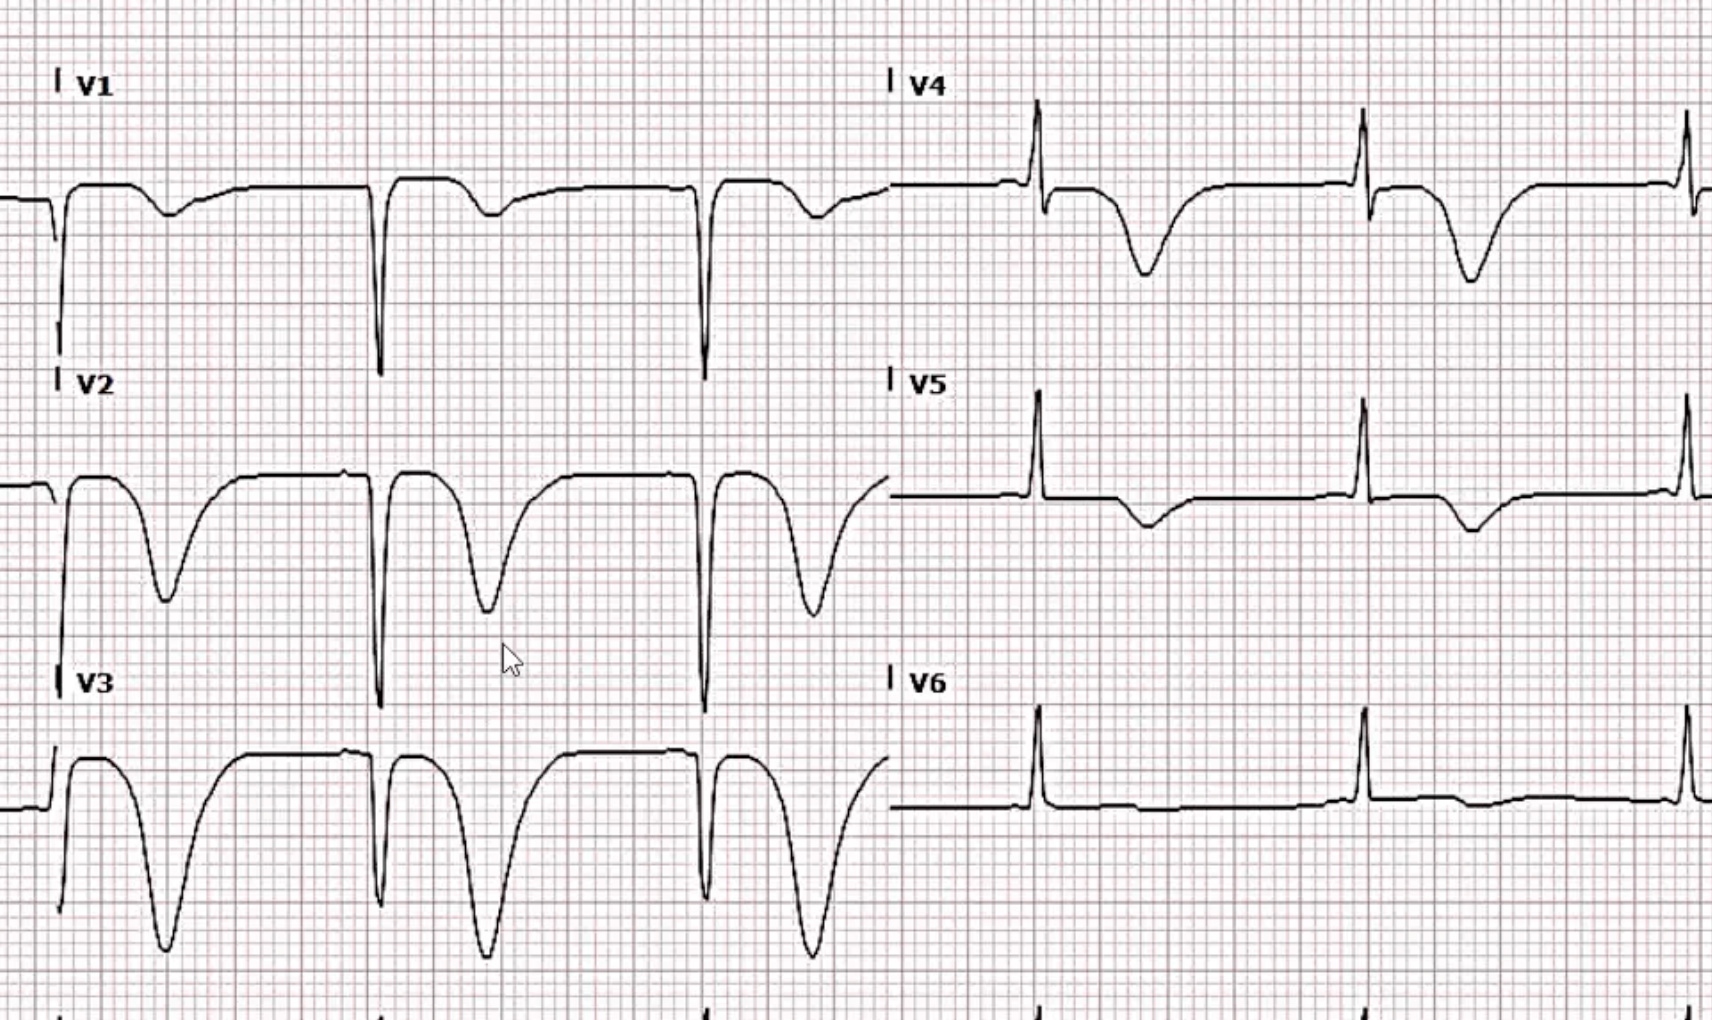
- Highly specific for critical stenosis of the proximal LAD and often do poorly with medical therapy
- However do not mix with the right ventricular strain pattern:
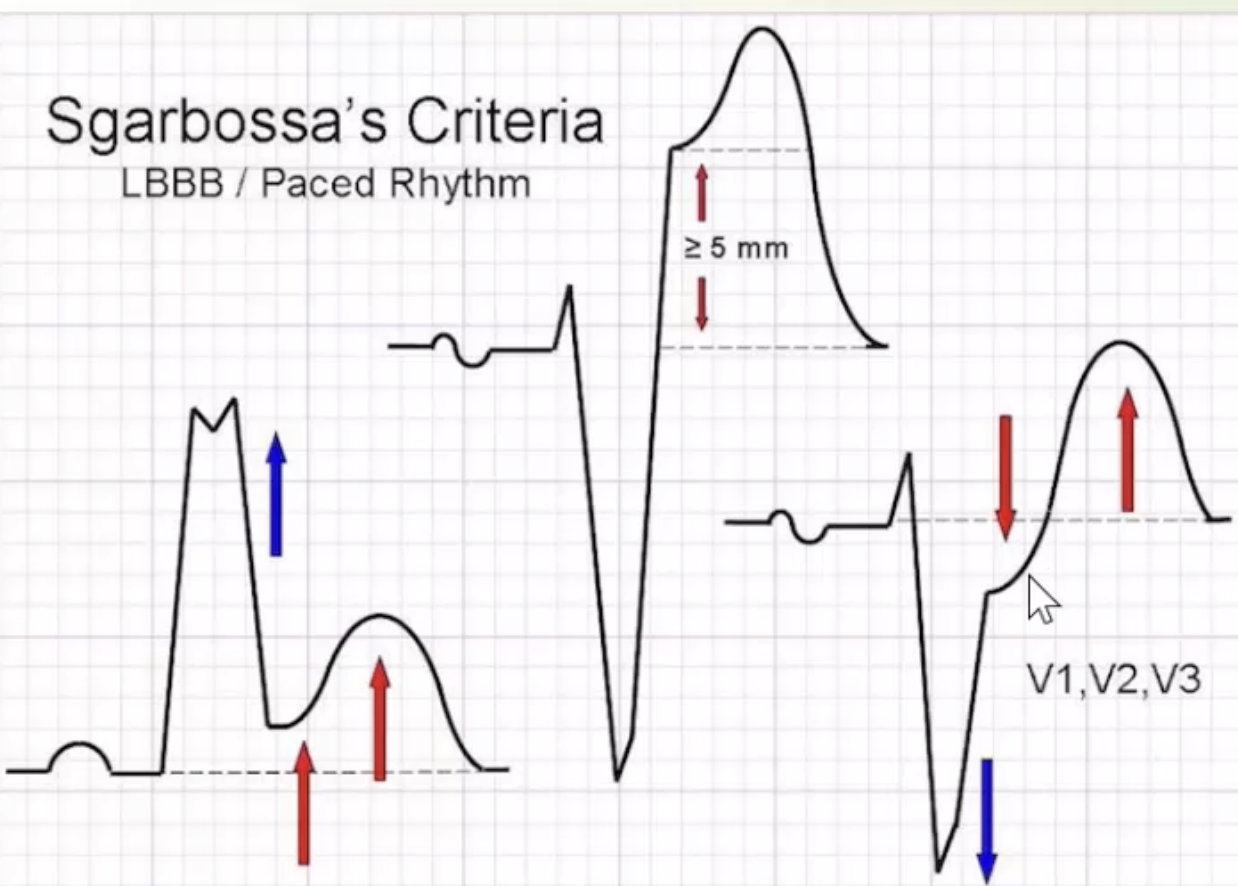
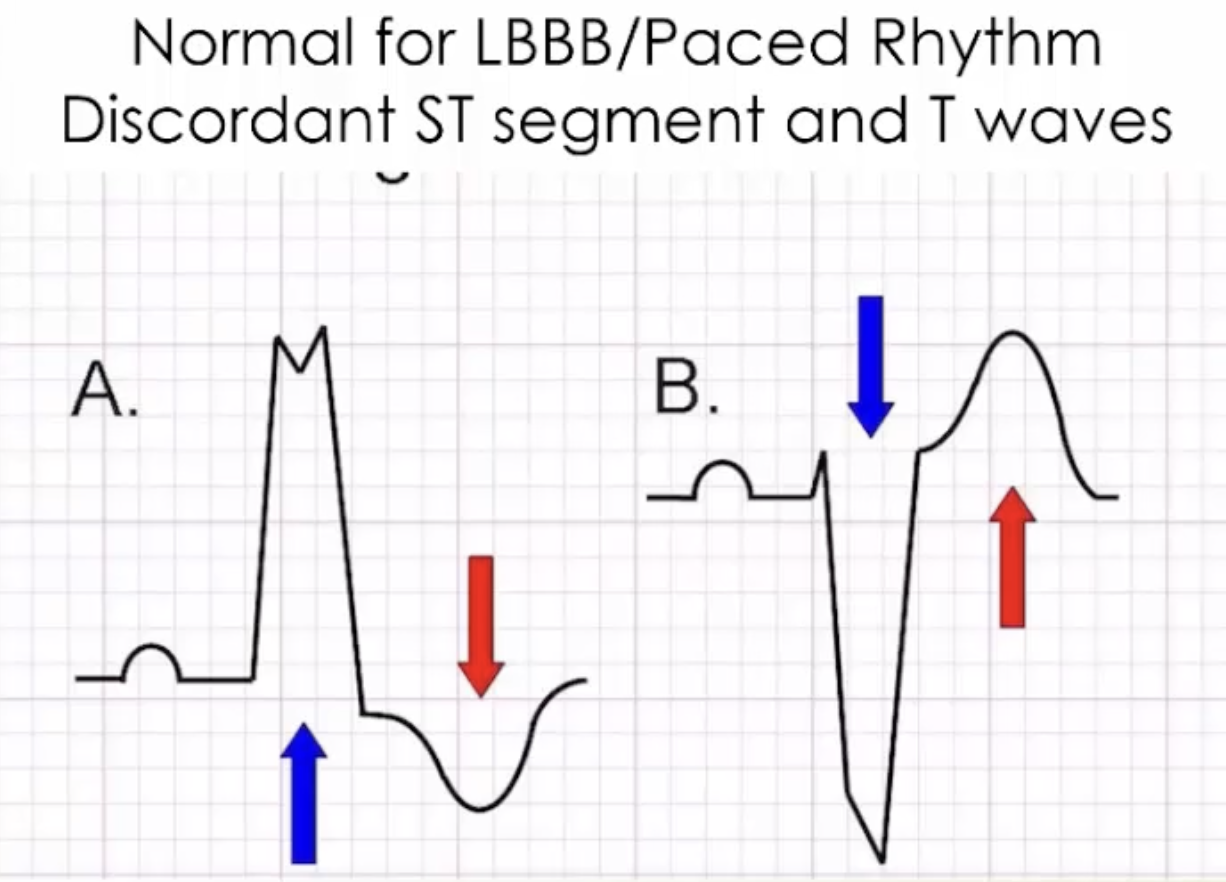
- ST and T wave changes in LBBB/paced rhythms
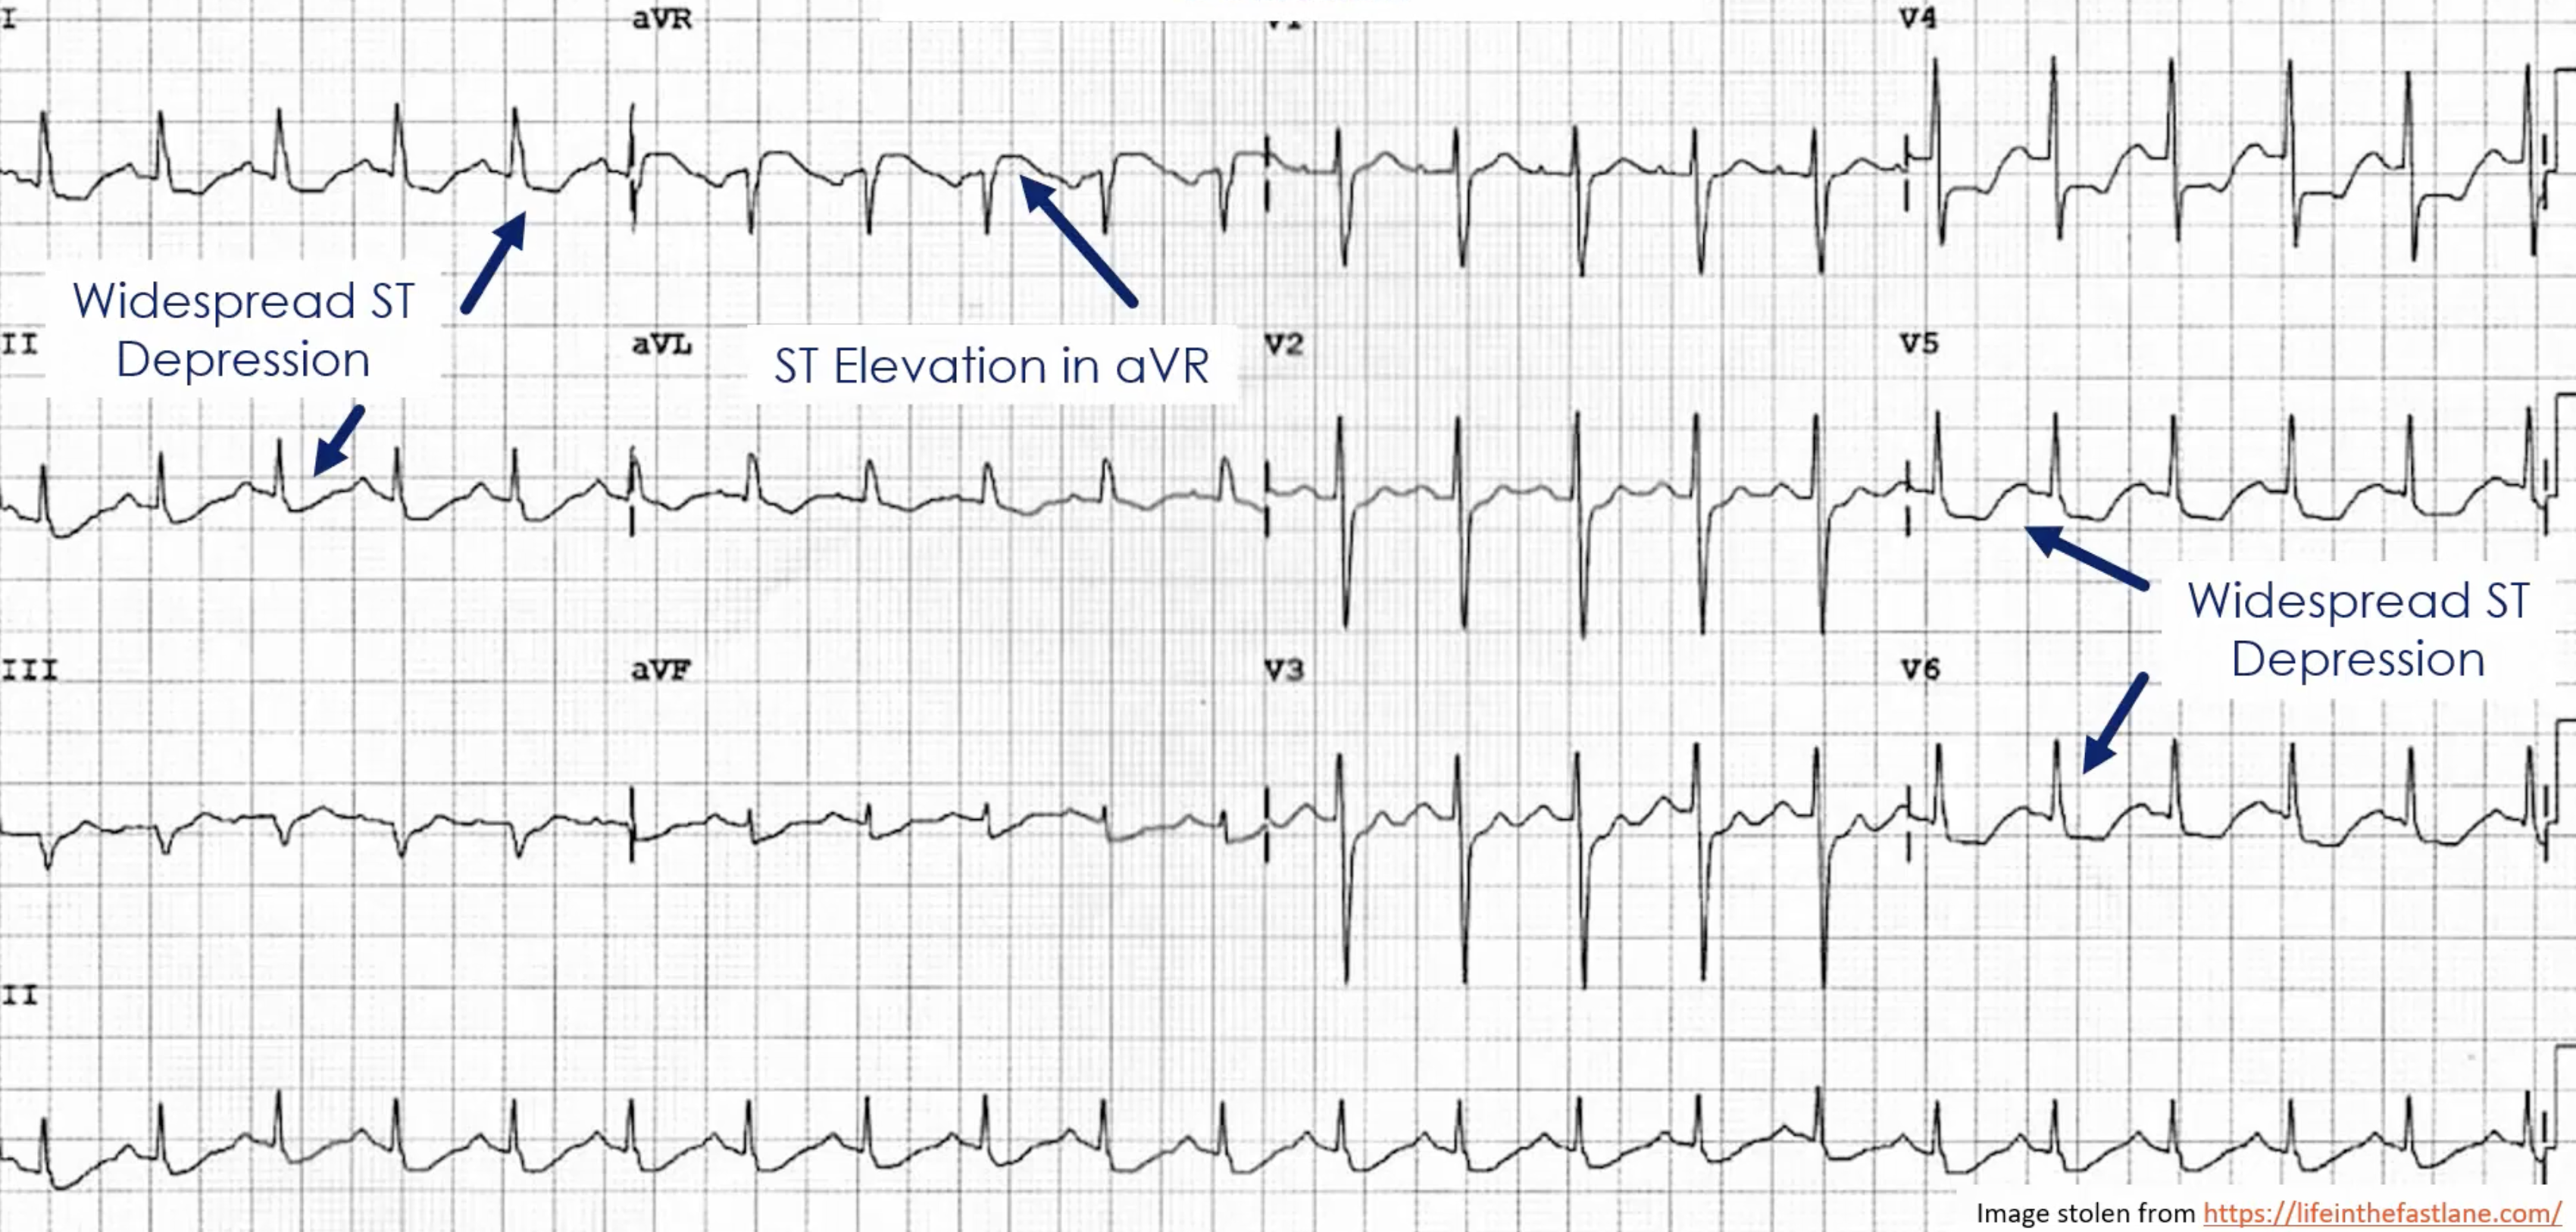
- Left main coronary artery occlusion
- ECG features (although note that these findings aren’t necessarily specific)
- Widespread ST depression in mostly leads I, II and V4-6
- ST elevation in aVR ≥1mm
- ST elevation in aVR ≥ V1
- ECG features (although note that these findings aren’t necessarily specific)
- Other ECG patterns:
- ST depression in 2 or more precordial leads may indicate transmural posterior injury
- Hyperacute T-wave changes may be observed in the early phase of STEMI
- New RBBB and LAFB is highly associated with proximal LAD occlusion
Conduction Disease
Sinus Node Dysfunction
Sinus Arrhythmia
https://www.youtube.com/watch?v=H6yTQm2h8dc
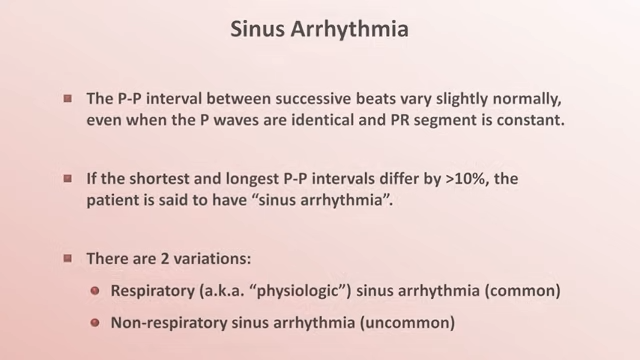
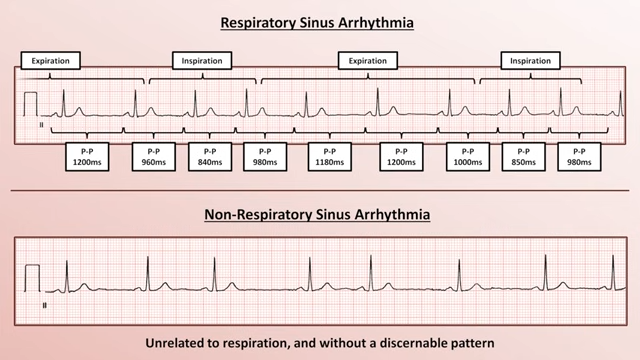
- Note that all the P waves as the same morphology indicating that they likely originate from the same area/place
SA Nodal Exit Block
- Depolorisation of the SA node itself does not produce any discernable ECG features
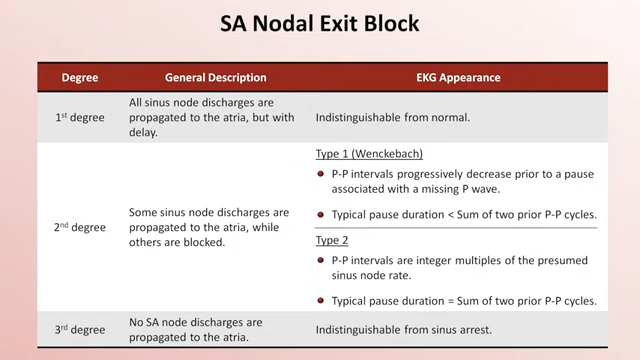
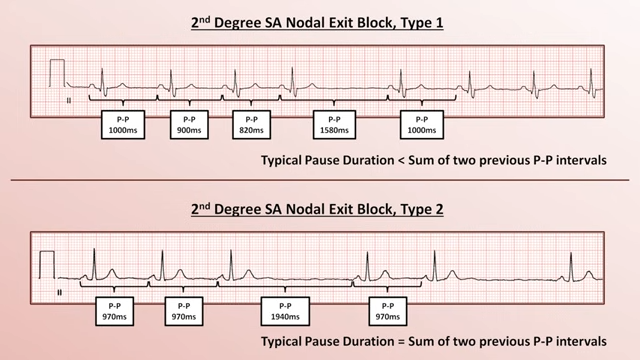
- Difficult to diagnose SA nodal exit block on ECG, generally some kind of EP study is needed
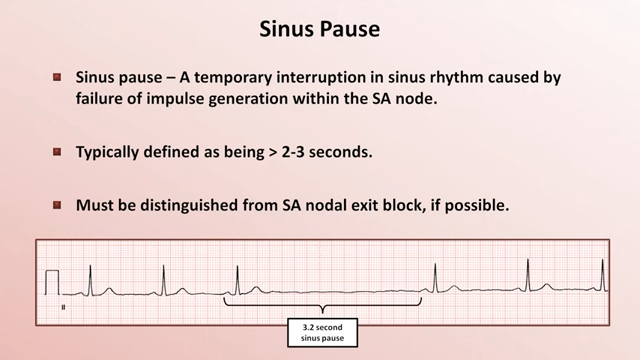
Sinus Pause
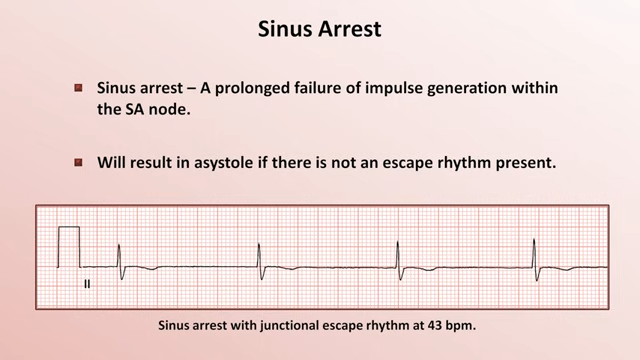
Sinus Arrest
- Sinus arrest = long sinus pause
- Will result in asystole if no escape rhythm present
- Will result in asystole if no escape rhythm present
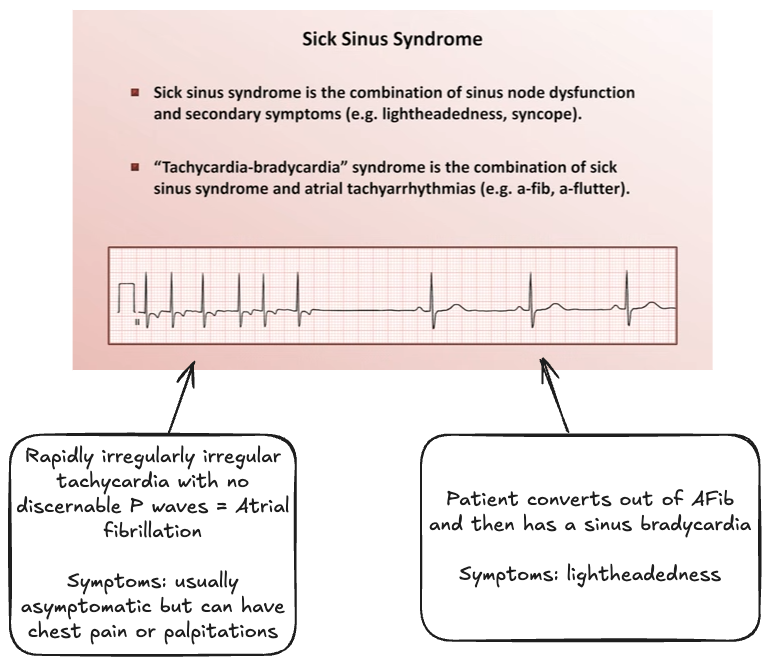
Sick Sinus Syndrome
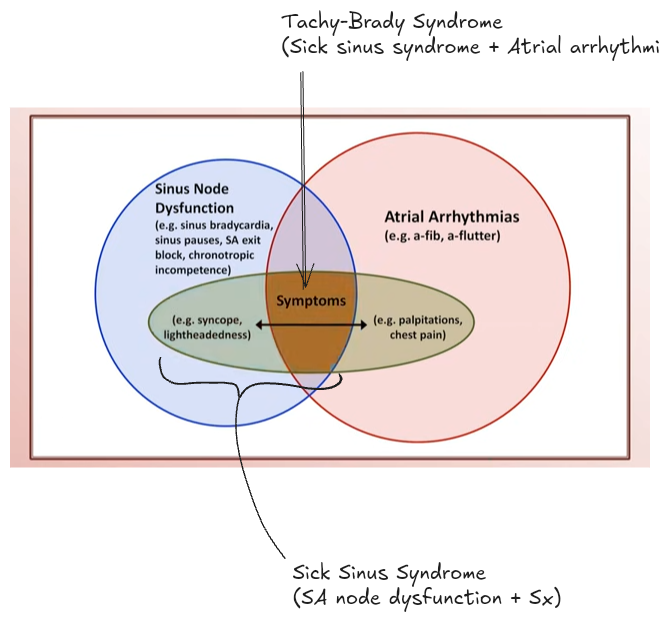
- Sick sinus syndrome = sinus node dysfunction + secondary symptoms (e.g. lightheadedness, syncope, heart failure symptoms)
- Tachycardia-bradycardia syndrome = sick sinus syndrome + atrial tachyarrhythmia (e.g. atrial flutter or atrial fibrillation)
Tachyarrhythmias
Hypertrophy
- Broadly speaking, the changes in hypertrophy are:
- Chamber can take longer to depolarise ⇒ ECG wave increases in duration
- Chamber can generate more current and larger voltage ⇒ ECG wave increases in amplitude
- A larger percentage of the total electrical current can move through the expanded temperature resulting in a shift of the axis